Make a sheet
Ask your agent for a budget, a tracker, a forecast or a report, from a line, a CSV or your Excel file. It opens in AllyHub's editor beside your chat, works like Excel, and exports to Excel with its formulas live.
Ask for a sheet and it opens beside your chat: real formulas, tables, charts, all of it working like Excel. Then mark up what’s wrong and your agent fixes it. Making sheets is free, and you don’t need an account.
Start from one line
Section titled “Start from one line”Say what goes in it and what you want to see. Attach your data as it is: an export from your bank, your store or your CRM. Start with Use AllyHub: your agent may have its own way to make a spreadsheet, and this tells it which one you mean.
Use AllyHub to build a sheet of our 2026 revenue from this export: month, revenue, cost, profit, margin and growth month on month, with totals and a chart of revenue, cost and margin.Back came a sheet that does the maths itself. Profit, margin and growth are formulas, so change a number and everything follows. Revenue got bars, margin a colour scale, growth arrows, and the chart puts margin on its own axis.
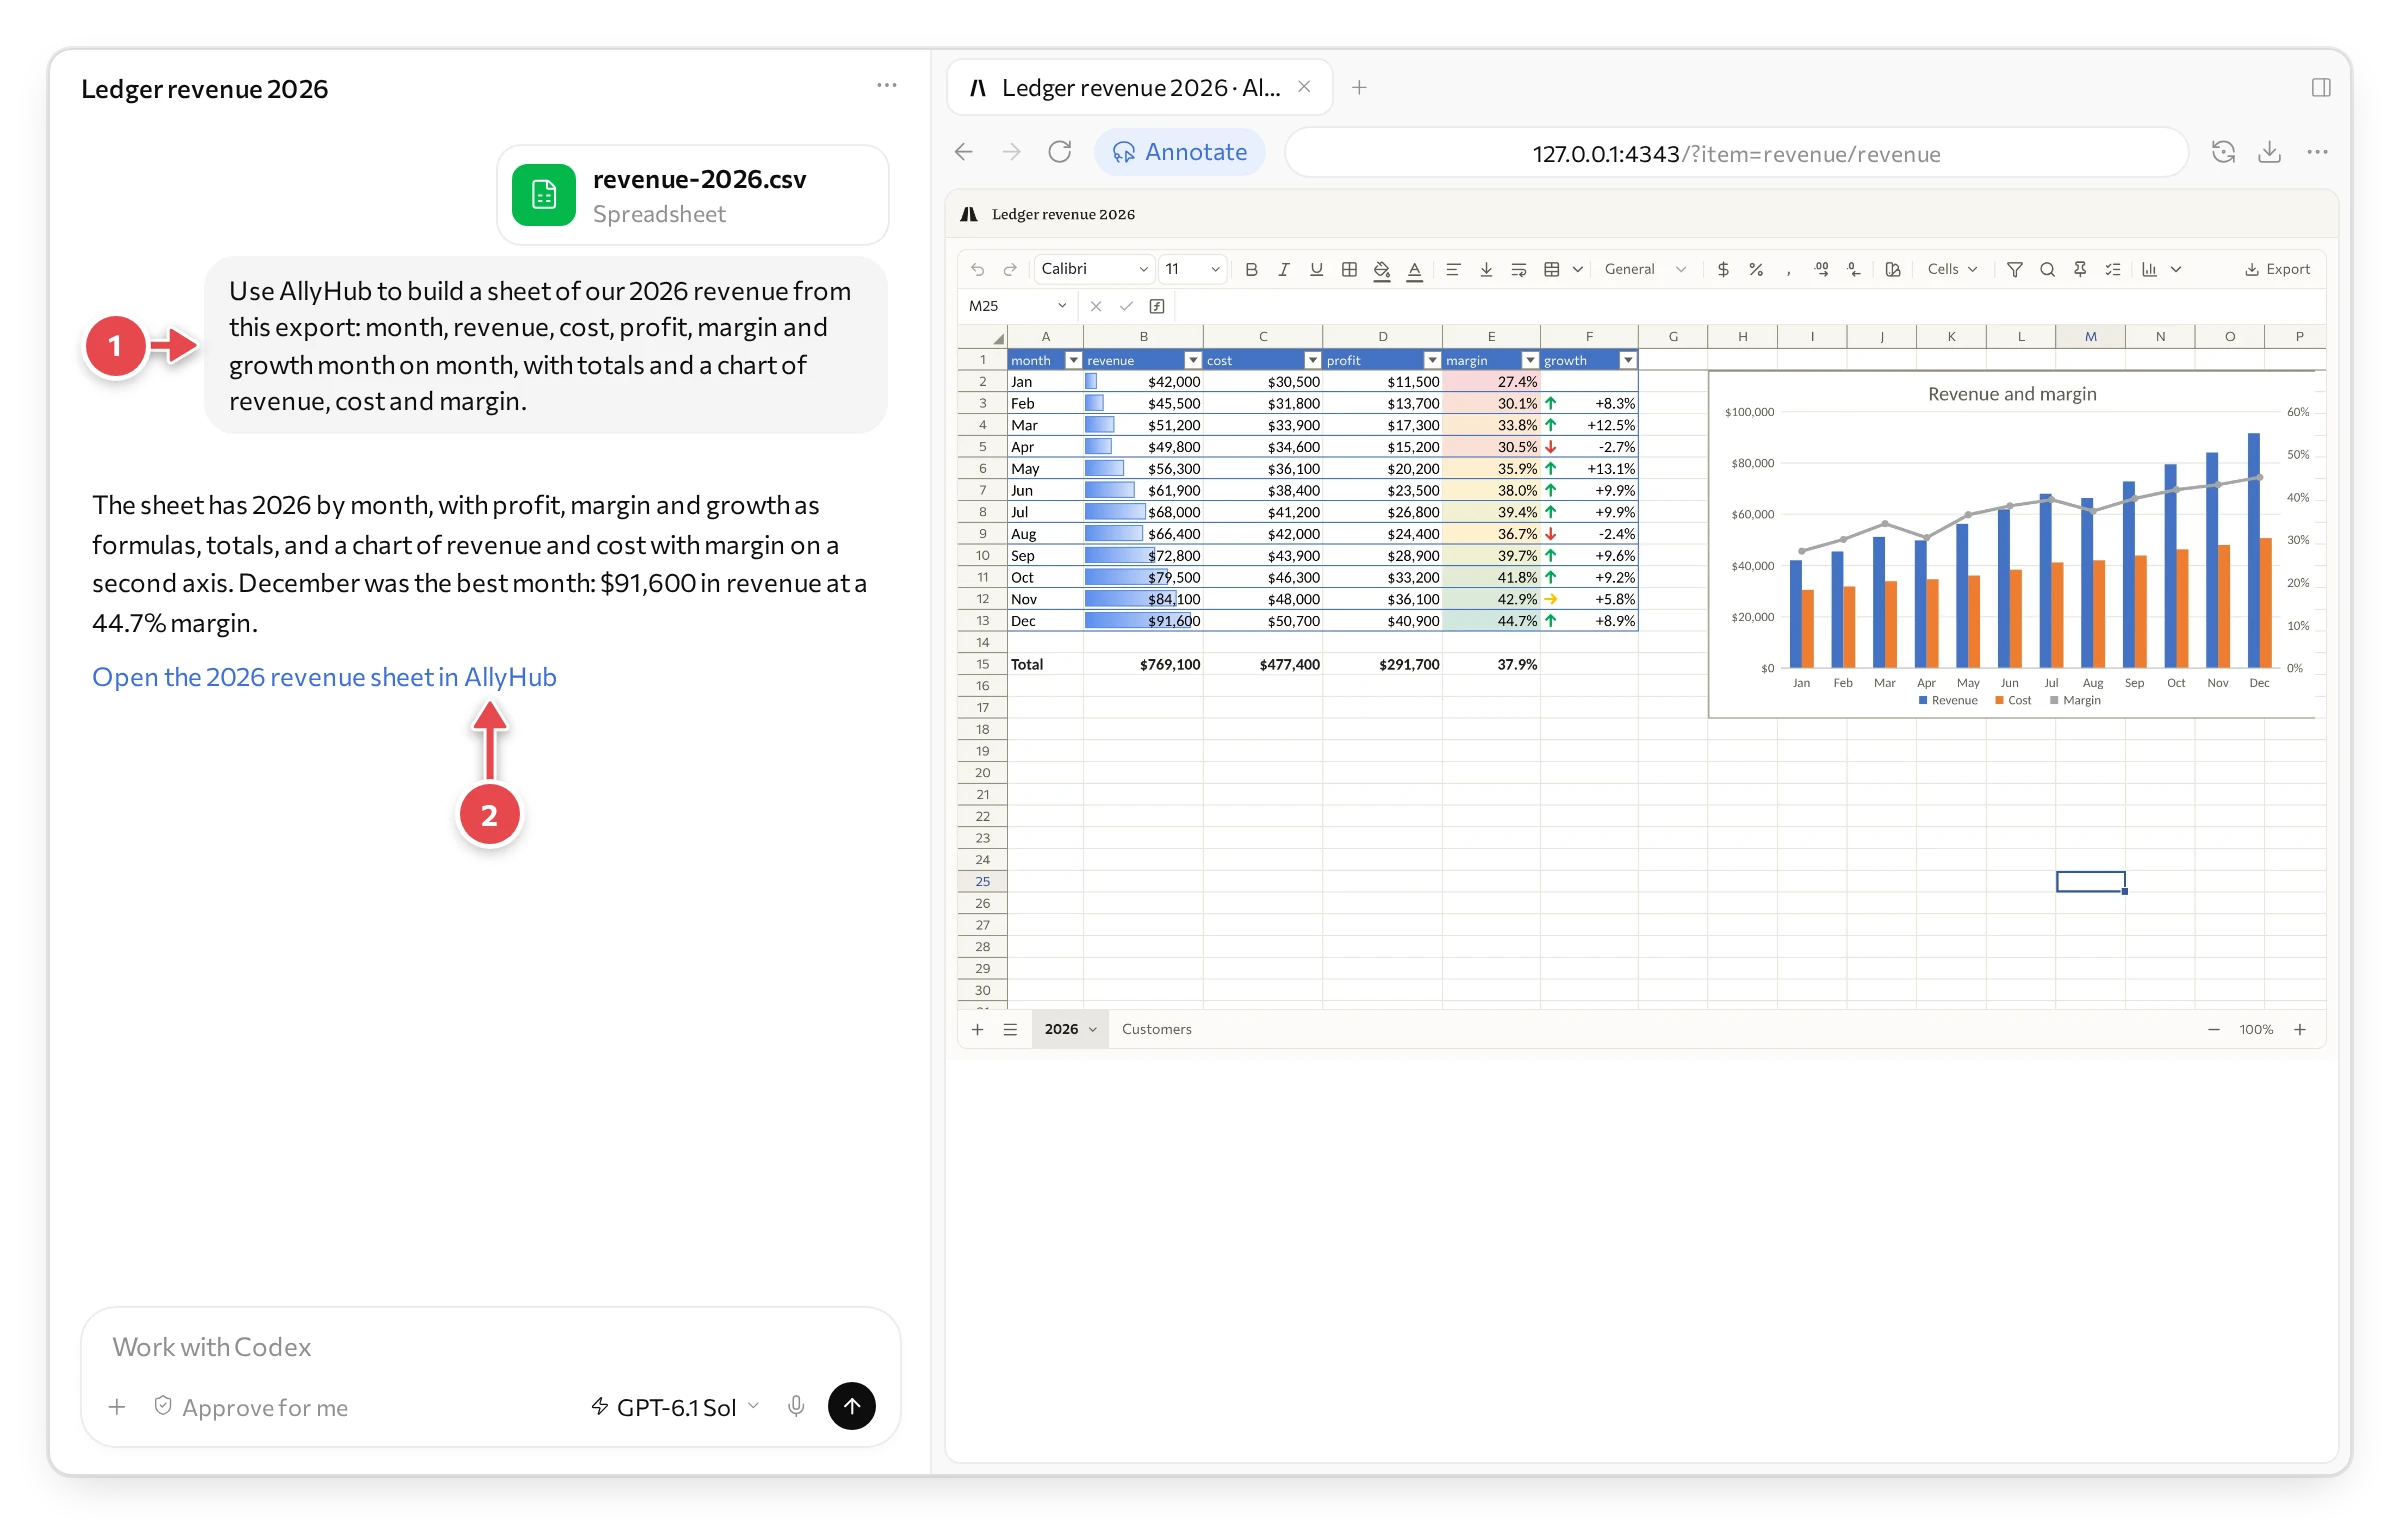
1 What we asked, with the export. 2 The link that opens the sheet again.
Bring your Excel file
Section titled “Bring your Excel file”Already have a spreadsheet? Attach it and say what it should become:
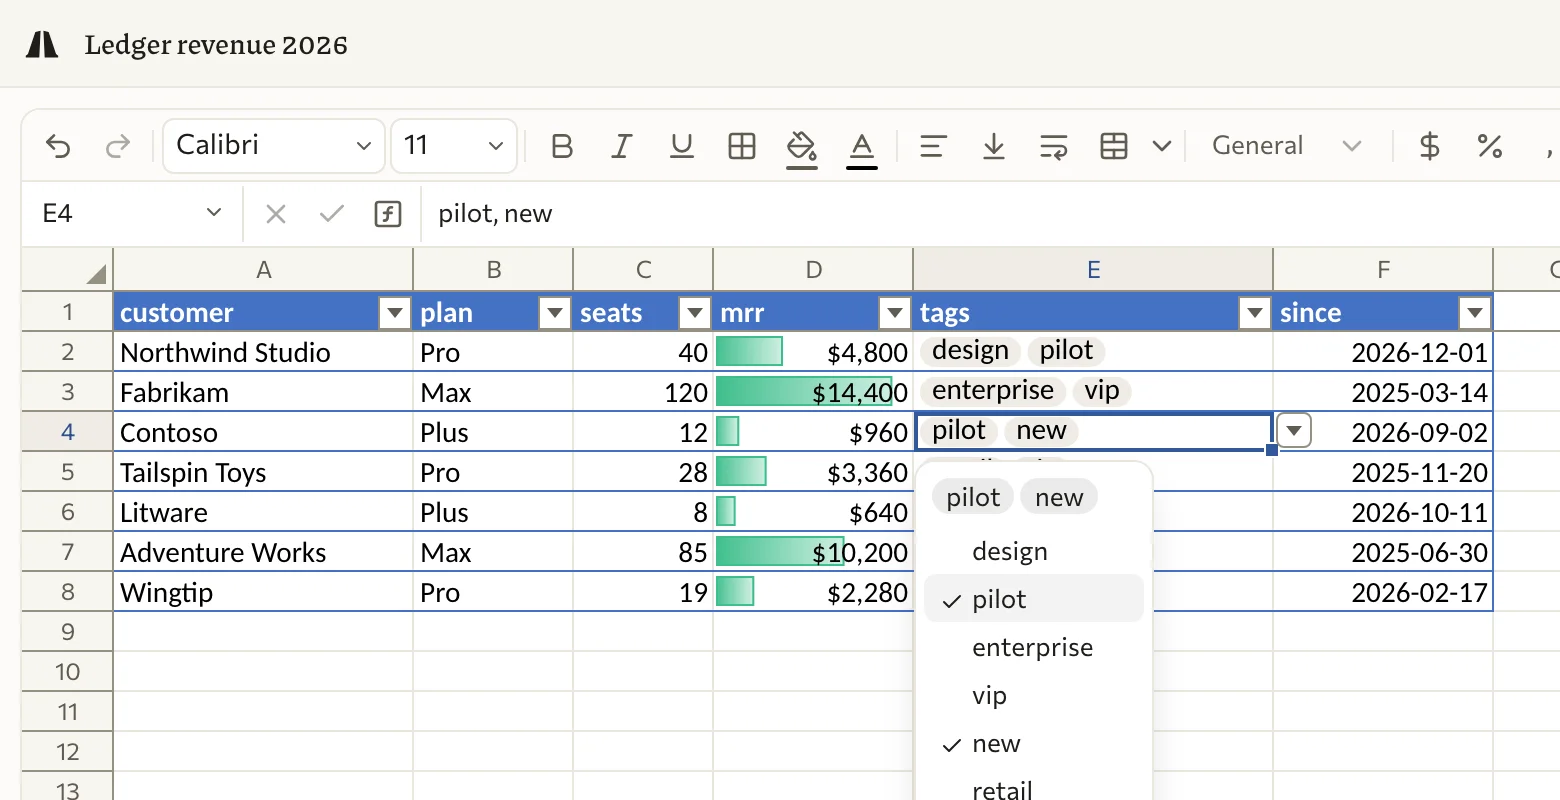
Use AllyHub to turn our customer list into a sheet we can keep up to date: the plan picked from a list, tags we can pick several of, and monthly revenue as bars.The list came back as a table you can sort and filter, with the plan as a dropdown and tags as chips.
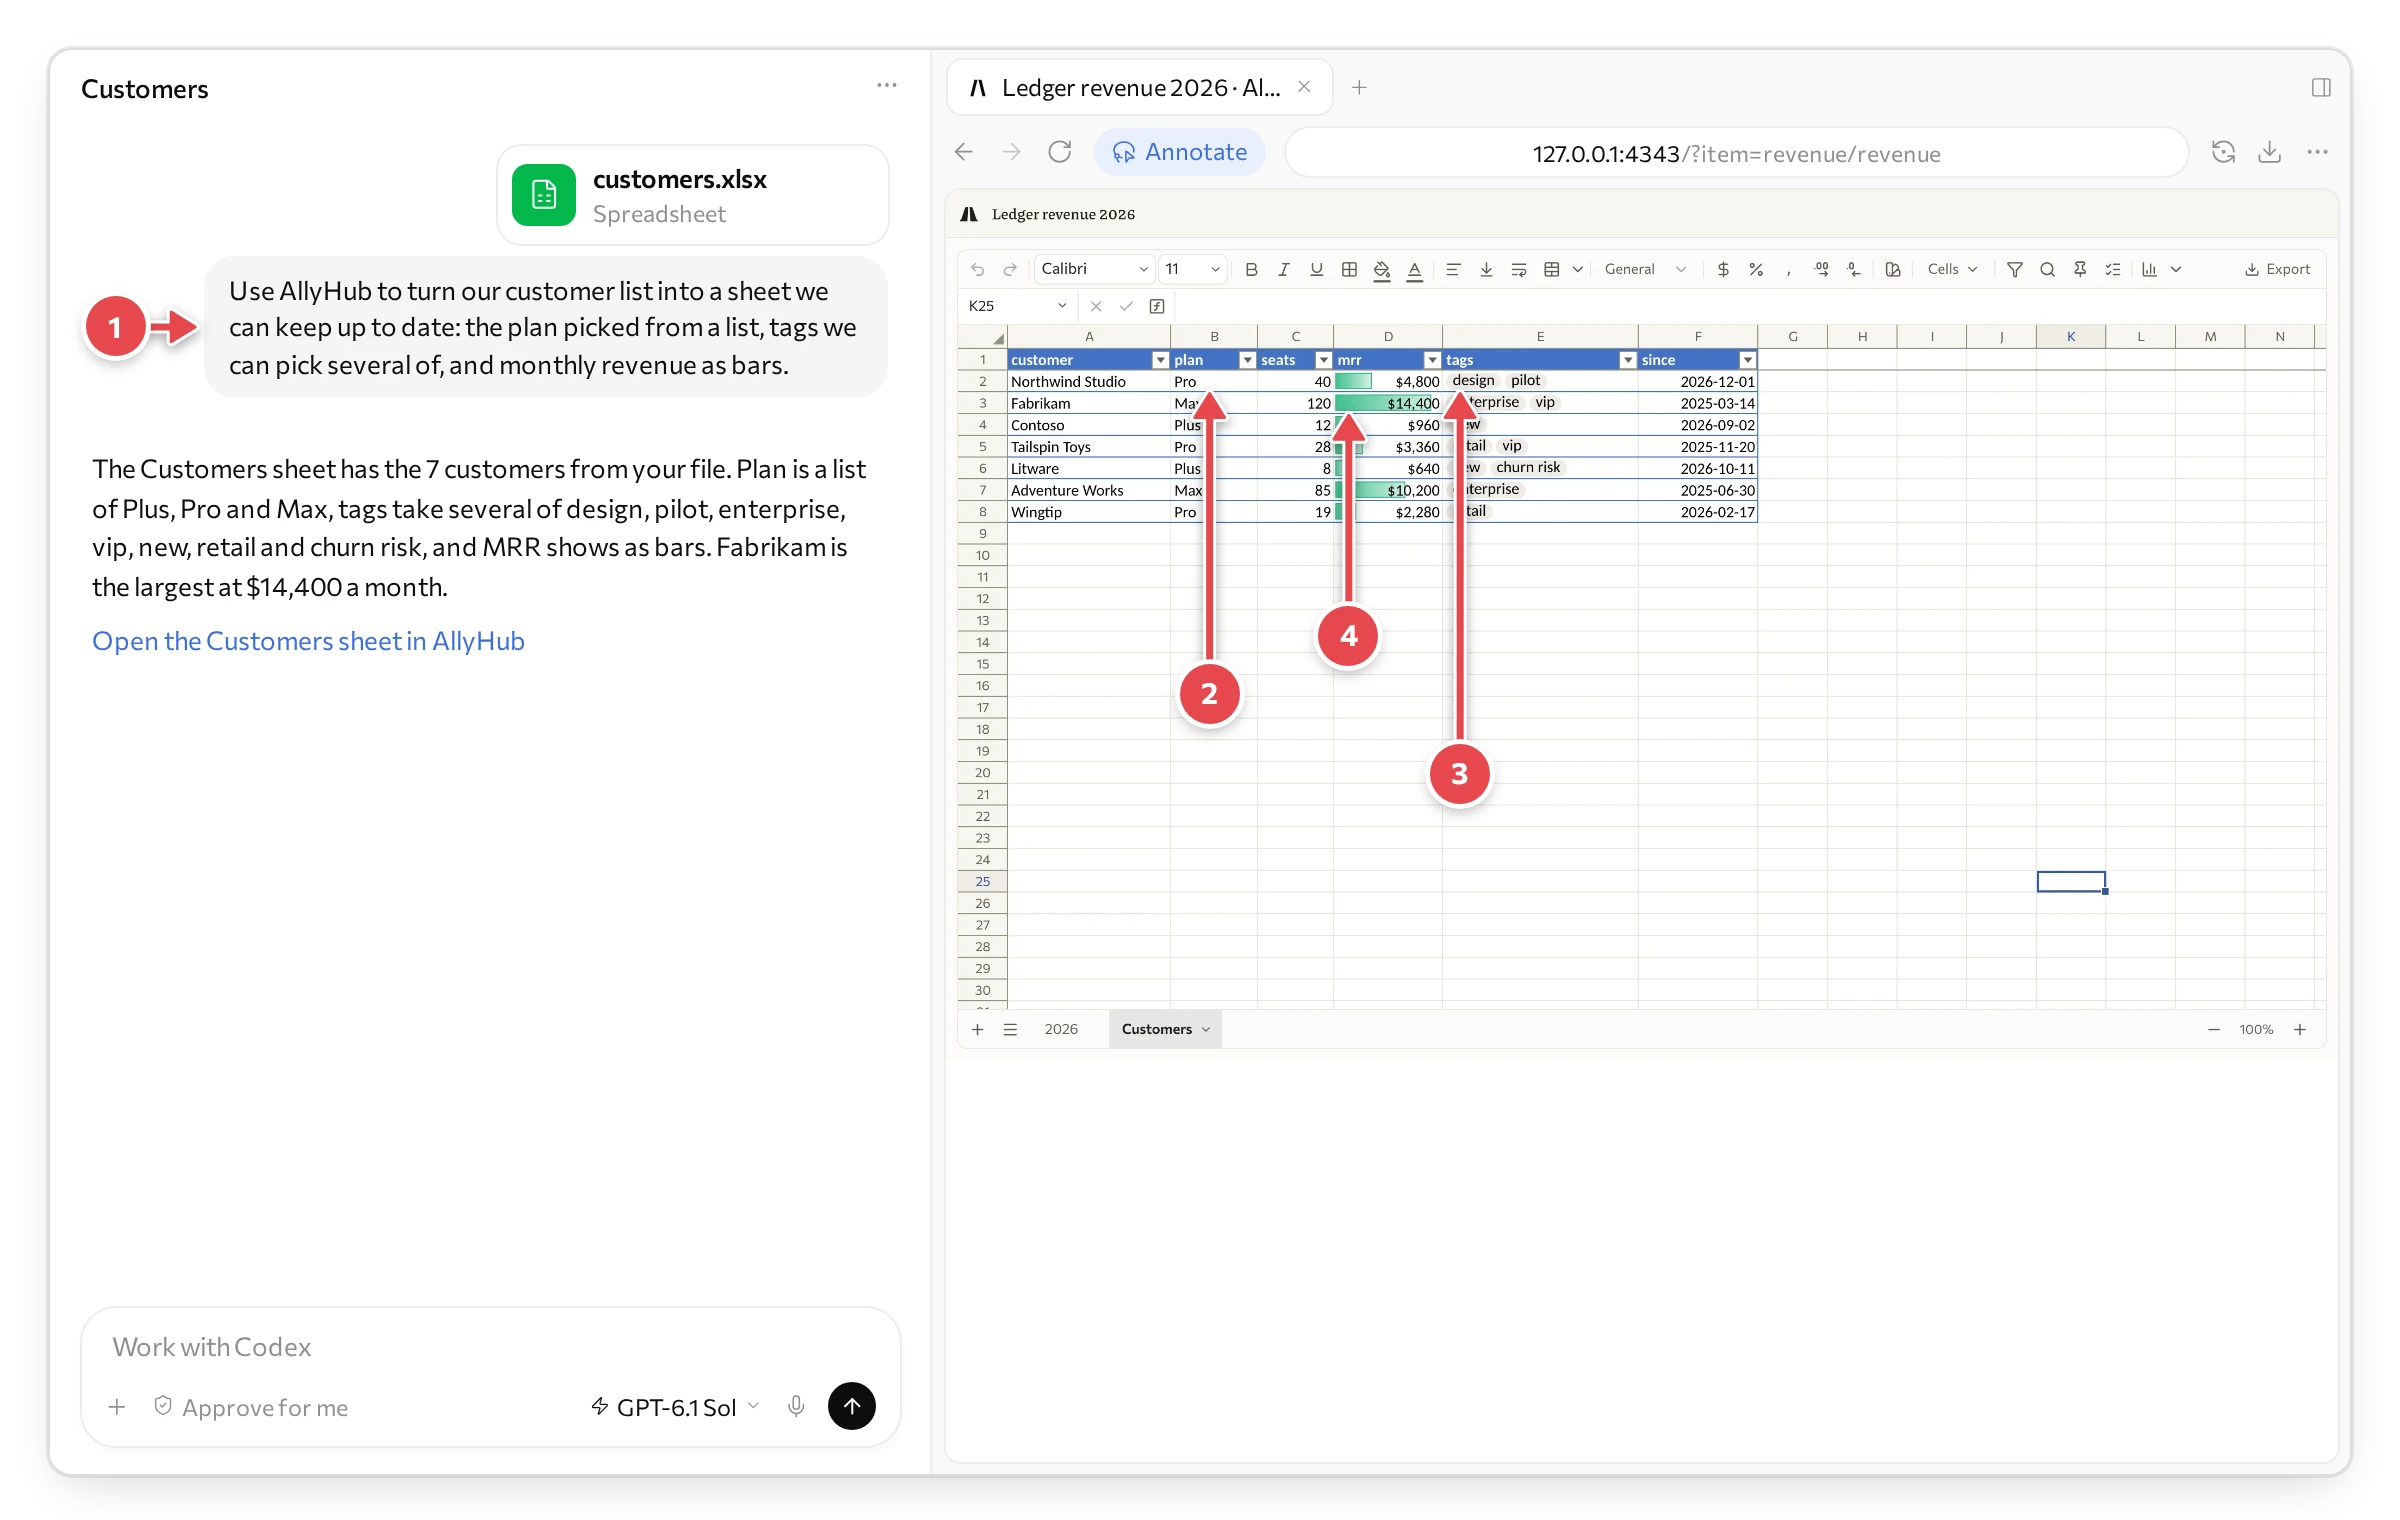
1 The Excel file, attached. 2 The plan, from a list. 3 Tags, several to a customer. 4 Monthly revenue as bars.
Formulas, formats, tables, filters, charts and notes come across from Excel. Macros and pivot tables don’t, and your agent tells you what was left behind.
Get a better first version
Section titled “Get a better first version”A few words in your request go a long way:
- The columns: “month, revenue, cost, profit”. Say which ones are worked out, and how.
- The numbers that matter: “totals”, “growth month on month”, “margin as a percentage”.
- How it should look: “bars for revenue”, “red when margin drops below 30%”, “arrows for growth”.
- What to choose from: “plan from a list: Plus, Pro, Max”. People then pick, instead of typing.
- The chart: what it shows, and what goes on a second axis.
Mark it up
Section titled “Mark it up”Circle what’s wrong, and your agent fixes it. A box round the chart and “add profit as a line” says more than a paragraph.
In ChatGPT, you mark up with its Annotate button:
- Press Annotate at the top of the browser pane.
- Drag a box round the part: a cell, a column, a chart.
- Write what to change, and press the tick.
- Press Send. Your note goes to the chat, and your agent gets to work.
In Claude’s app, press the pointer button at the right end of the pane’s address bar, mark what you mean with its pen, box or text, then press Add to chat.
Or just say it in the chat: “add a quarterly summary”, “sort by margin”, “show 2025 beside it”.
Watch it fix it
Section titled “Watch it fix it”The editor shows your agent at work: AllyHub is editing at the top, and a dot on the sheet’s tab. Here the chart gets its profit line while you watch.
Edit it yourself
Section titled “Edit it yourself”A number, a label, a colour? Click and type, as in Excel. What you change is saved to the sheet, and your agent sees it next time you ask.
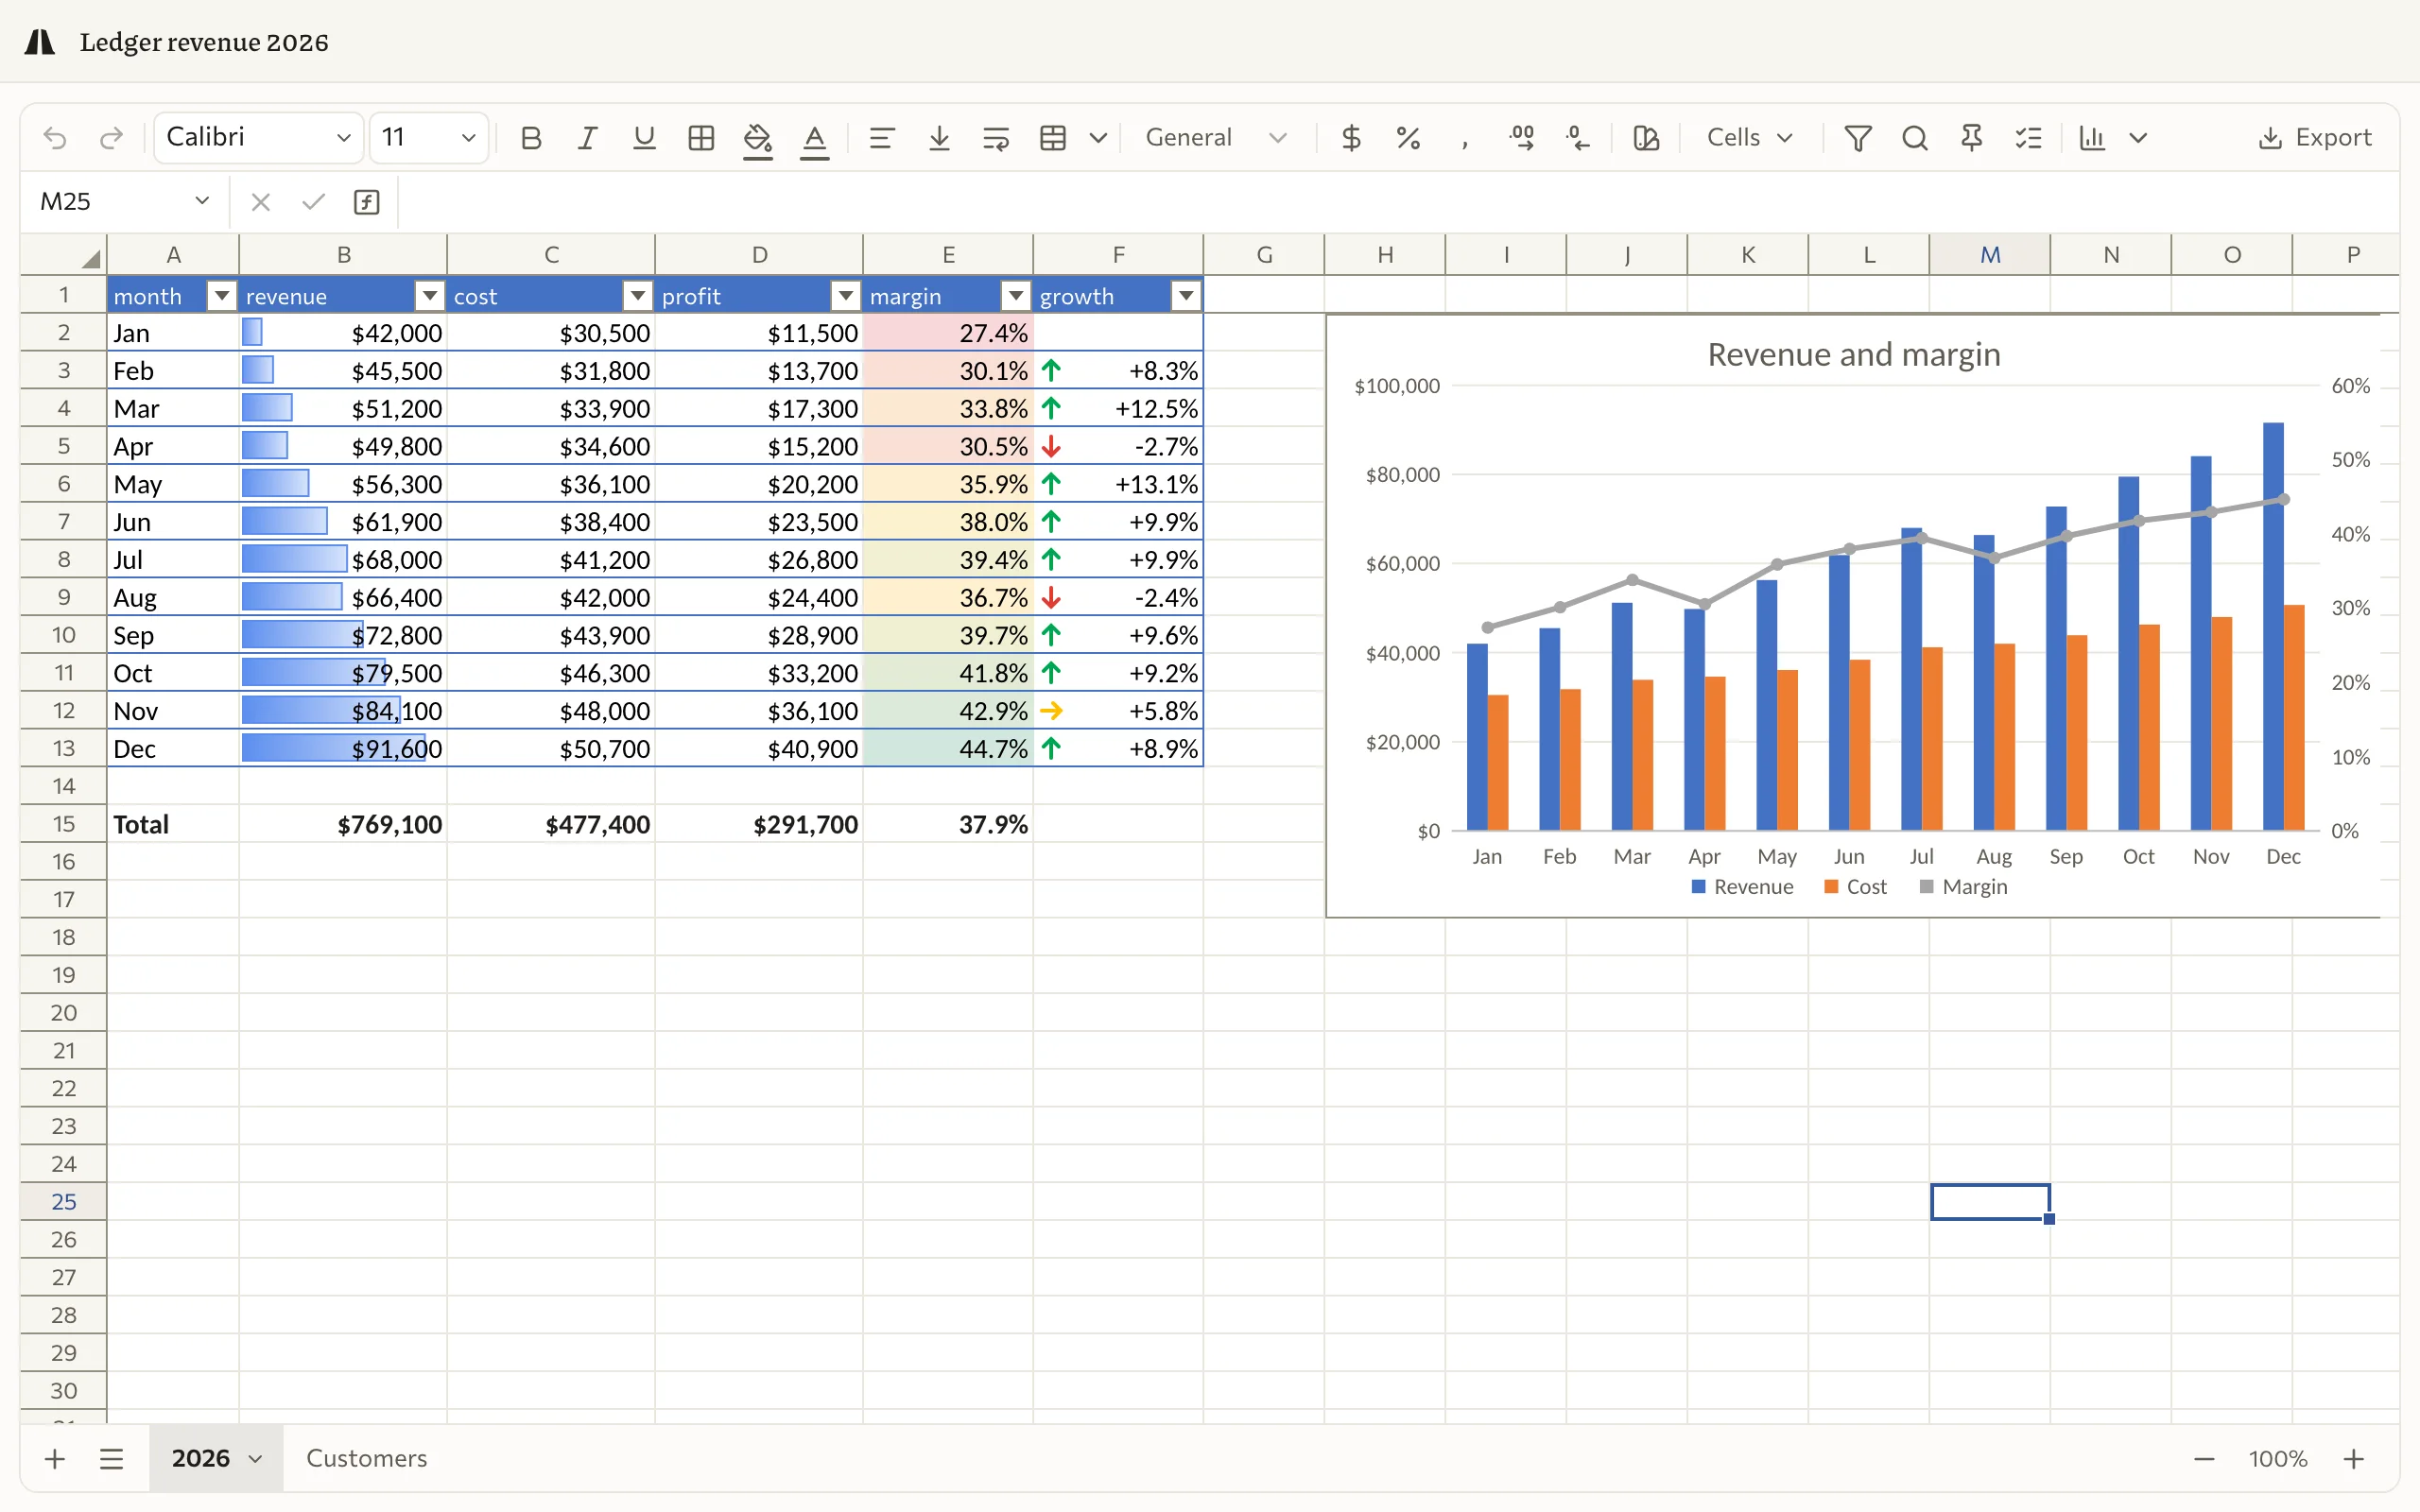
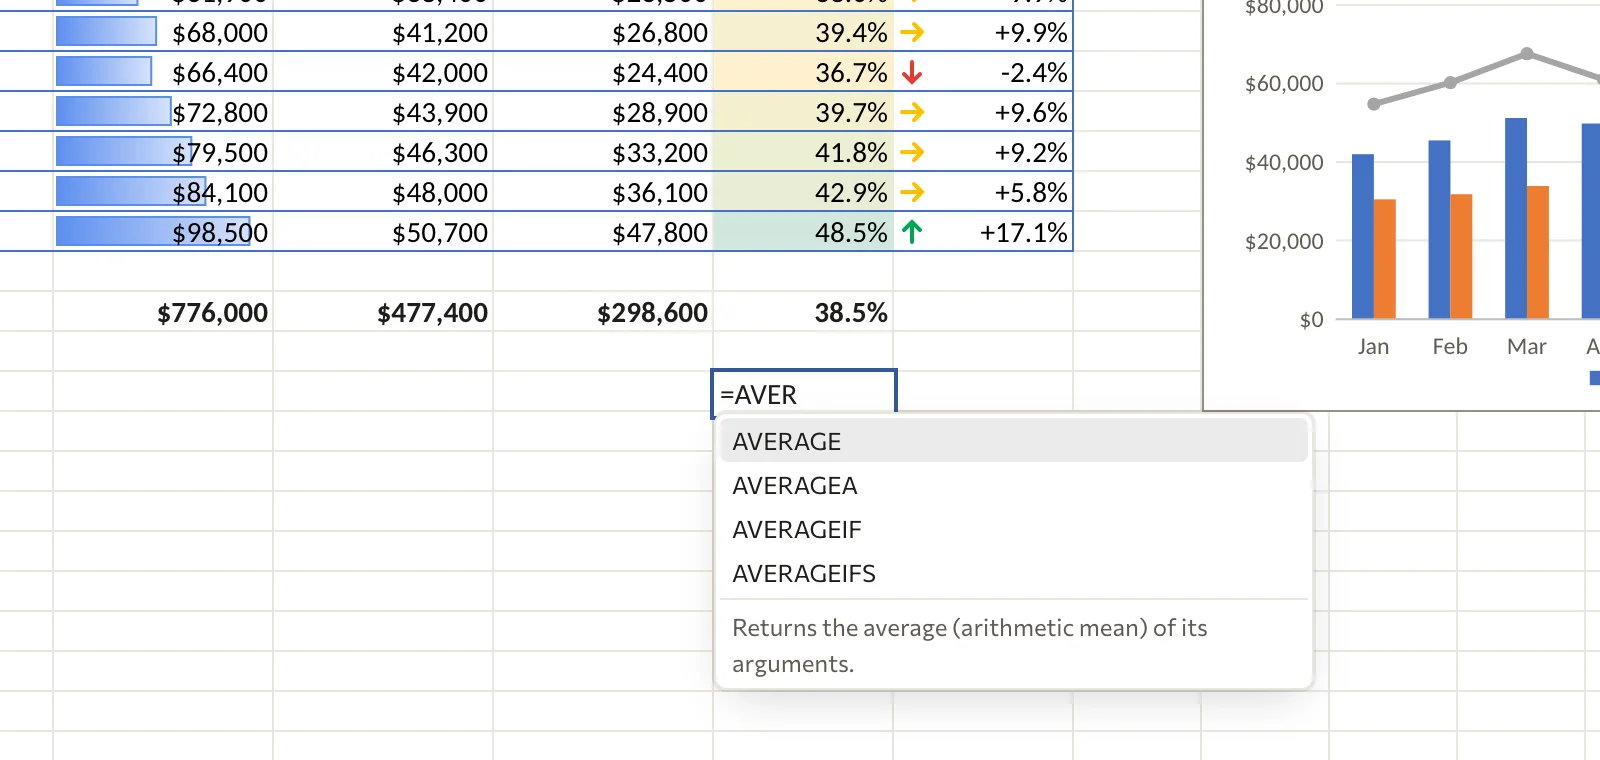
Here we typed a new December, and profit, margin, growth, the totals and the chart all followed. Then an average with a formula, made a percentage, and a tag ticked for a customer:
Formulas are Excel’s, and the editor suggests functions as you type:
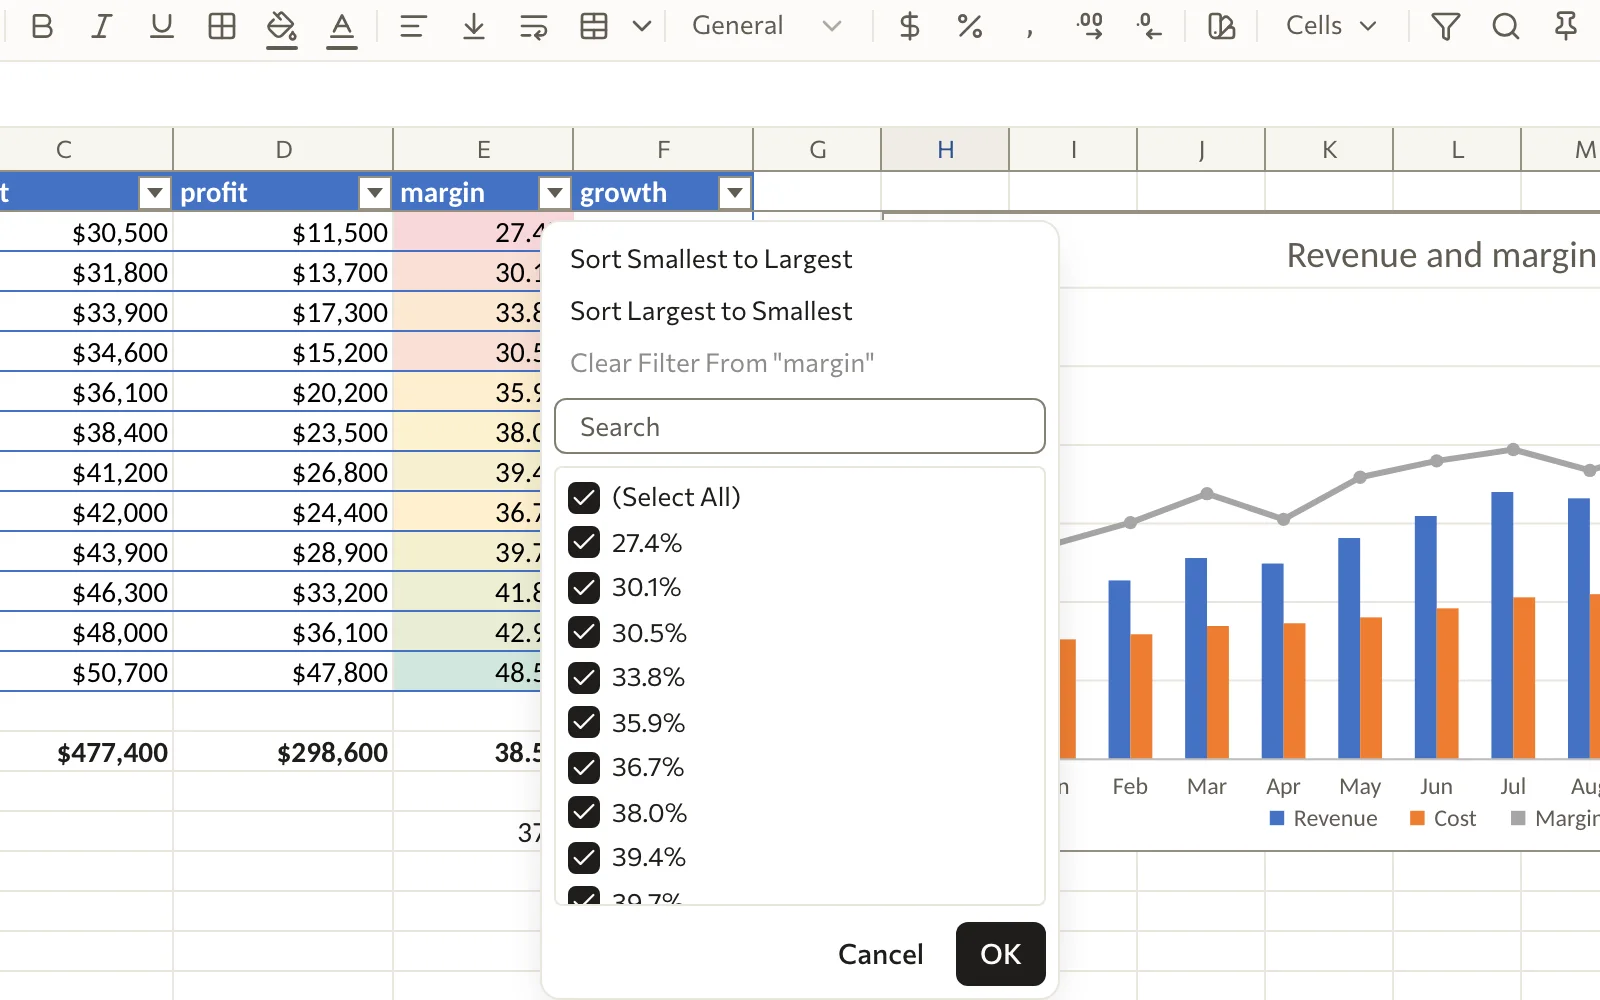
Tables sort and filter from their headers:
Dropdowns keep entries tidy, and can hold several choices at once, shown as chips:
Charts follow their cells. Click one for its Chart Design bar: change its type, its data, its title or its legend. There are 16 kinds, and a column chart can carry a line on a second axis.
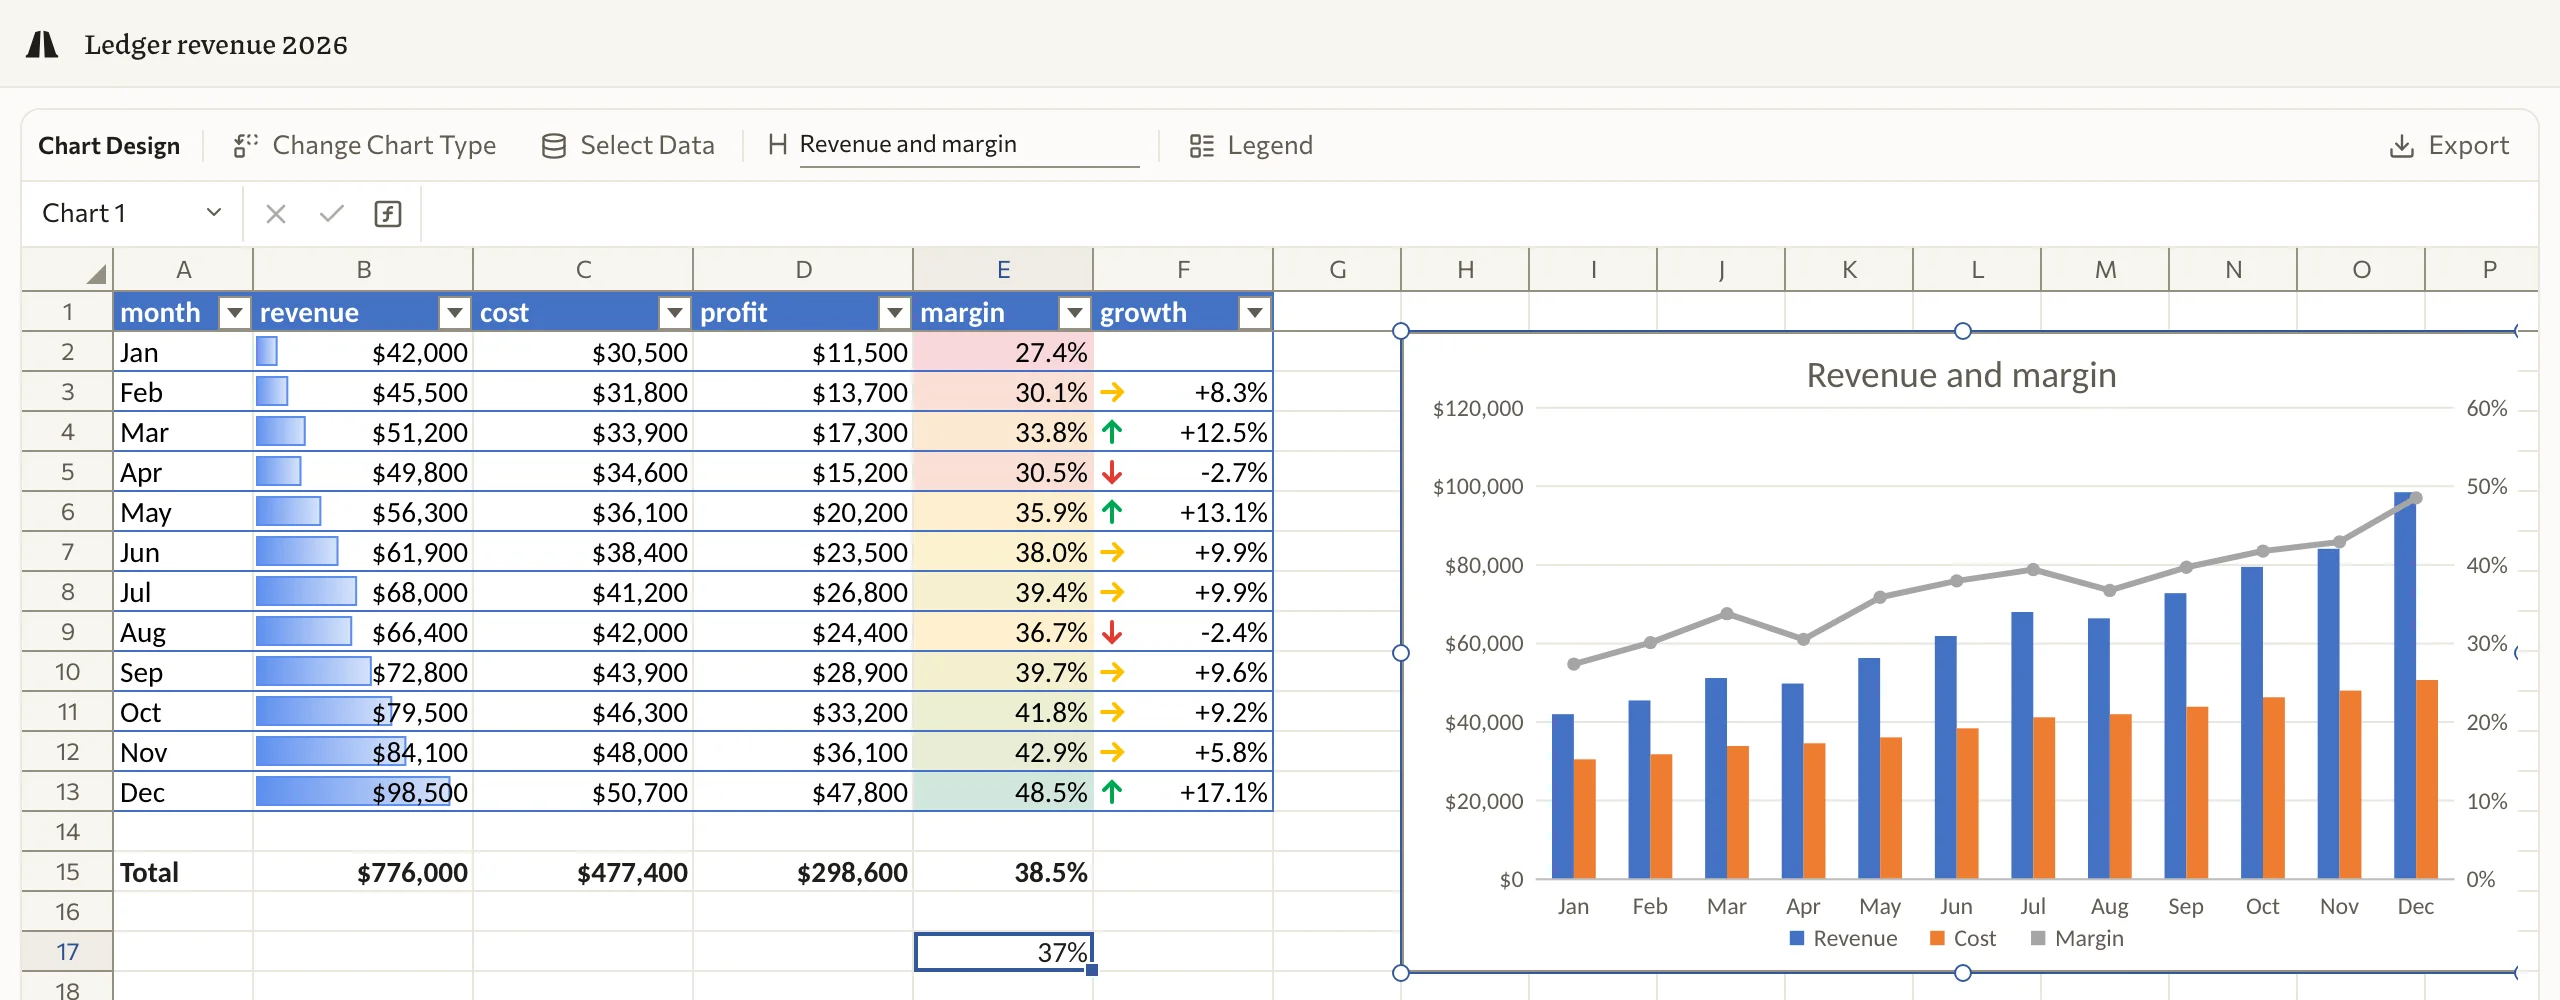
The toolbar has the rest you’d expect: number formats, colours and borders, conditional formatting (bars, colour scales, icons), freeze panes, find, data validation and more sheets.
Get the file
Section titled “Get the file”Press Export at the top right of the editor, pick a Format, and press Export.
| Format | Good for |
|---|---|
| Excel | Working on in Excel. Formulas stay live, with tables, filters, formats, dropdowns and charts |
| Sending or printing | |
| PNG | Posting or pasting as a picture |
| CSV | Another tool: one file a sheet |
Or just ask your agent for the file.
What’s free
Section titled “What’s free”Making, changing and exporting sheets is free, with no account. AllyHub’s AI tools cost credits: AI research on real data, and AI images and voice; see Pricing.