You log into Seller Central, navigate to the Brand Analytics dashboard, and see a wall of reports — Search Query Performance, Market Basket Analysis, etc. You know this data is supposed to be powerful. But what does each report actually tell you? And more importantly: what do you do with it?
That's the gap this guide closes. Amazon Brand Analytics (ABA) is one of the most underutilized free tools on the platform. Brand-registered sellers have access to behavioral data on millions of Amazon shoppers — what they search, what they click, what they buy together, who they are. Most sellers barely scratch the surface.
We'll walk through every ABA report in this post, what each metric actually means for your business, and how to go beyond what ABA alone can reveal.
Key Takeaways
- Amazon Brand Analytics is a free tool available exclusively to Brand Registry sellers — it provides Amazon first-party, aggregated customer search, purchase, and demographic data that third-party tools generally cannot access directly.
- ABA includes multiple dashboards: Search Query Performance, Search Catalog Performance, Top Search Terms, Market Basket Analysis, Demographics, Repeat Purchase Behavior, and Customer Loyalty Analytics — each answers a different business question.
- An Amazon brand analyst uses ABA alongside other data sources to optimize listings, refine PPC campaigns, identify bundling opportunities, and diagnose conversion problems — it's the analytical engine behind every high-performing Amazon brand.
- ABA data is underutilized because sellers find the interface clunky, data exports require manual work, and many don't know which metrics to prioritize for their specific goals.
- For most brands, Search Query Performance is often the most immediately actionable report because it shows where shoppers drop off across impressions, clicks, cart adds, and purchases for specific search queries.
What Is Amazon Brand Analytics?
Amazon Brand Analytics is a suite of free reporting tools inside Amazon Seller Central, available to sellers enrolled in Amazon Brand Registry. It provides aggregated, anonymized data on how shoppers search, browse, and buy on Amazon — including their demographics, their repeat purchase patterns, and which products they compare before buying.
Think of it as Amazon's own analytics layer — data that only Amazon has, made available to brands that have gone through the Brand Registry process.
Here's what makes ABA fundamentally different from third-party tools like Jungle Scout or Helium 10:
Feature | Amazon Brand Analytics | Third-Party Tools (Jungle Scout, Helium 10) |
Data source | Amazon's own internal data | Estimates + scraped data |
Accuracy | 100% accurate (first-party data) | Estimated — directionally useful, not exact |
Click and conversion data | Yes — actual customer behavior | No — estimates only |
Demographics | Yes — age, income, gender, education | No |
Repeat purchase data | Yes — actual repeat buyer counts | No |
Cross-sell data | Yes — what customers actually buy together | Estimated |
Cost | Free (with Brand Registry) | $39–$279/month |
Eligibility: Who Can Access ABA?
You need two things to access ABA:
- An active Professional selling plan ($39.99/month).
- Enrollment in Amazon Brand Registry with an active (or pending) registered trademark.
Once both requirements are met, ABA appears under the "Brands" menu in Seller Central → "Brand Analytics."
How to Access Amazon Brand Analytics
Step 1. Log into Amazon Seller Central with the account connected to your enrolled brand.
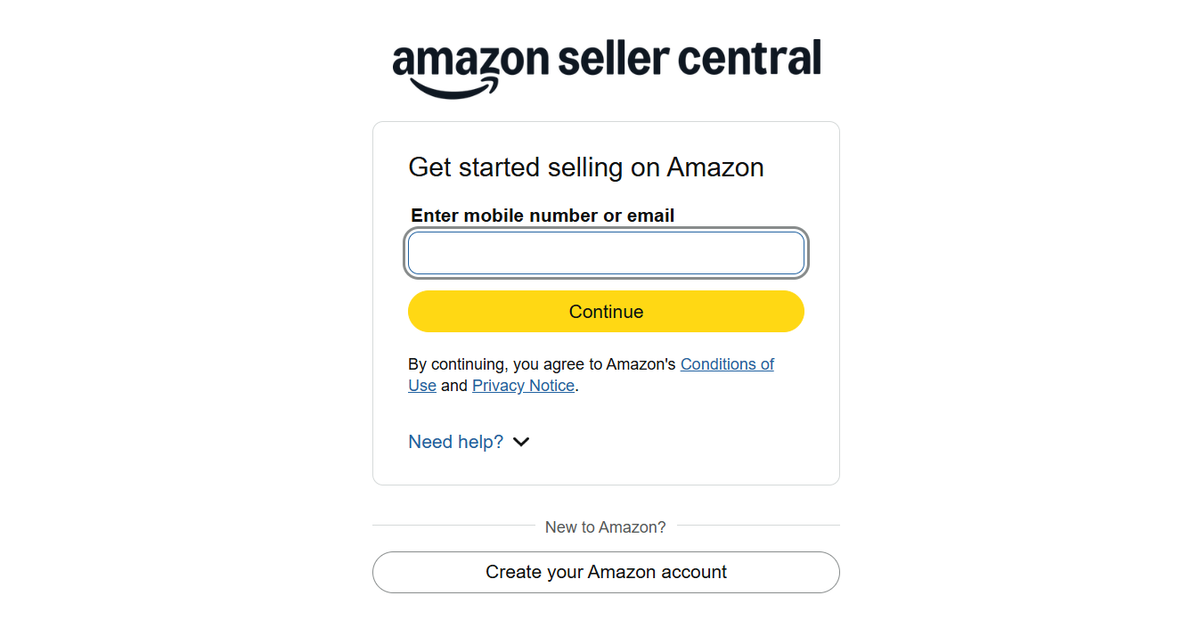
Step 2. Make sure your selling account and Brand Registry account are linked.
Step 3. In the top navigation, hover over Brands.
Step 4. Click Brand Analytics.
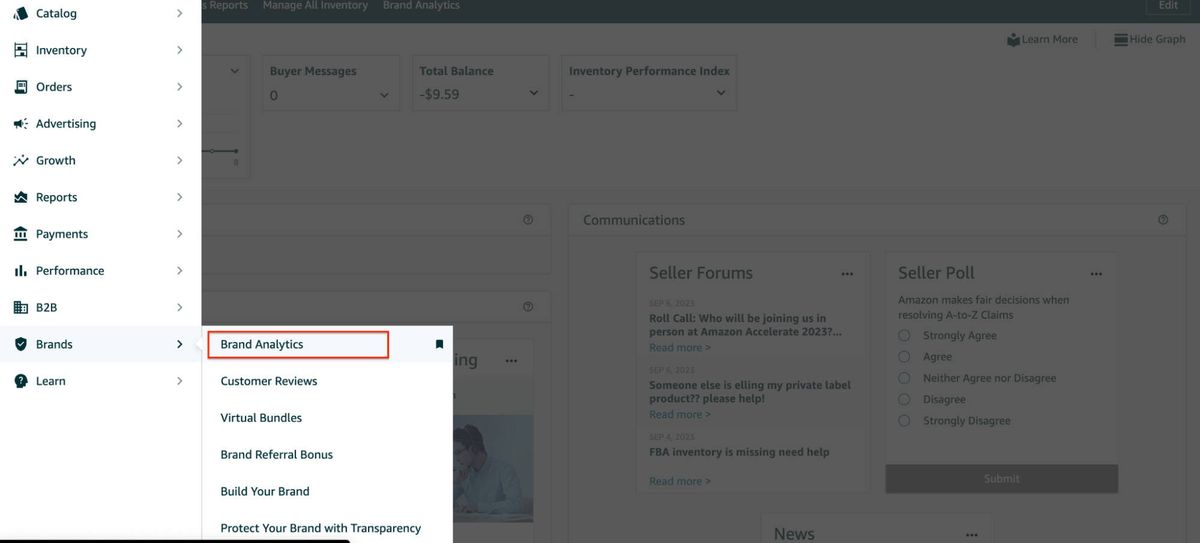
Step 5. Choose the dashboard you want to review.
If the Brands menu doesn't appear, your Brand Registry enrollment may not be complete or linked to your Seller Central account. Contact Amazon Seller Support to verify.
7 Amazon Brand Analytics Report Explained
Here's each report broken down — what it shows, which metrics matter, and what to actually do with the data.
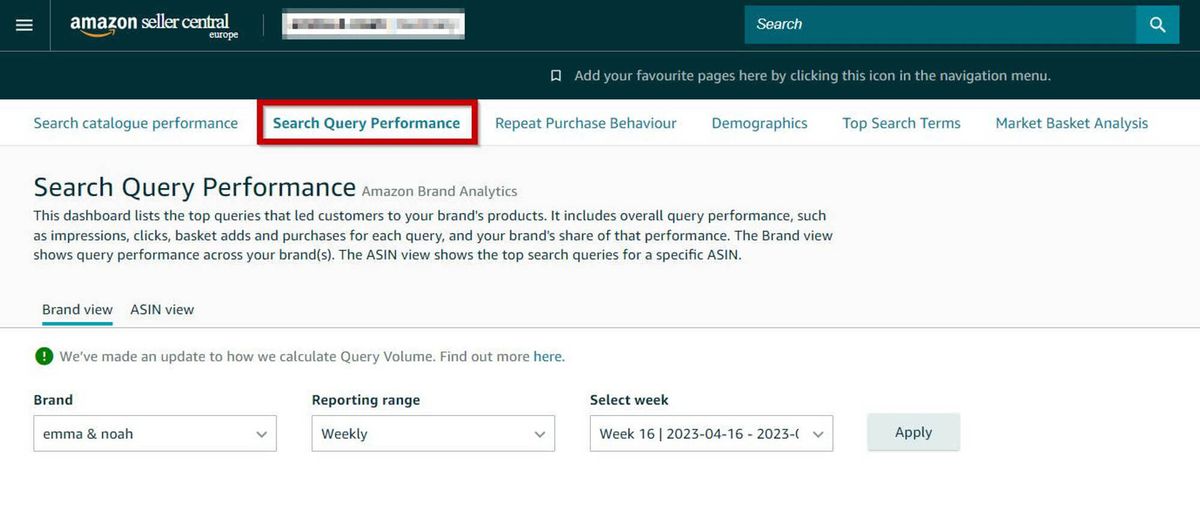
Search Query Performance
Search Query Performance is the most important report in ABA. It shows how shoppers interact with your brand's products for specific search queries — from the moment they see your listing to the moment they buy (or don't).
Key metrics:
- Impressions: How many times your product appeared in search results for that query.
- Clicks: How many shoppers clicked through to your product detail page.
- Cart Adds: How many shoppers added your product to their cart after clicking.
- Purchases: How many shoppers completed a purchase.
- Brand Share: Your brand's percentage of total impressions, clicks, cart adds, and purchases for that query — relative to all brands.
How to use it diagnostically:
Pattern | What does it mean | Action |
High impressions, low clicks | Your main image or title isn't compelling | Redesign main image; rewrite title to front-load key benefit |
High clicks, low cart adds | Your price point or bullet points aren't converting | Review pricing vs. competitors; rewrite bullets to emphasize differentiation |
High cart adds, low purchases | Likely lost to a competitor in the final comparison | Audit competing ASINs that show in "Frequently bought together" for your product |
Your brand share is low vs. competitors | You're visible but not winning | Check competitor pricing, review count, and A+ Content quality — these are usually the gap |
💡 Pro tip for marketers: Don't just track your own performance — compare your Brand Share metrics over time. If your click share is rising but purchase share is flat, your listing is getting more attention but failing to close the deal. That's a content problem, not a traffic problem.
Best for: Diagnosing why your product isn't converting, identifying which search terms drive the highest purchase rate, and measuring your competitive position for key keywords.
Search Catalog Performance
This report shows search engagement metrics for your brand's entire catalog — impressions, clicks, cart adds, and purchases across all your ASINs during the customer search journey.
How to use it:
- Portfolio triage: Identify which ASINs drive the most search visibility vs. which actually convert. Kill underperforming variants.
- Seasonal trend analysis: Track search engagement week-over-week to spot seasonal demand shifts before they impact sales.
- Category comparison: Compare catalog-level performance across different product categories to determine where to allocate marketing budget.
💡 Pro tip: Don't confuse Search Catalog Performance with Search Query Performance. Catalog Performance shows aggregate metrics for your ASINs. Query Performance shows performance per search term. Use Catalog for portfolio-level decisions; use Query for term-level diagnostics.
Best for: Portfolio-level analysis and identifying which products deserve more (or less) marketing investment.
Top Search Terms
This report lists the most popular search terms across all of Amazon, ranked by search frequency. For each term, it shows the top three products, including search frequency rank, brands, categories, and titles that shoppers clicked on, along with click share and conversion share.
How to use it:
- Keyword discovery: Find search terms with high volume that you're not currently targeting in your listing or PPC campaigns.
- Competitor intelligence: See which ASINs dominate the most valuable search terms — these are your direct competitors.
- Category mapping: Understand which categories Amazon associates with your target search terms — this can inform your category placement decisions.
💡 Pro tip: Look for high-volume search terms where the top three clicked products are significantly different from yours — these are blue-ocean keyword opportunities with existing demand but lower competitive density.
Best for: Expanding your keyword strategy and identifying untapped search volume.
Market Basket Analysis
This report shows which other products shoppers frequently purchase at the same time as your product. It reveals cross-sell opportunities that are invisible to standard sales reports.
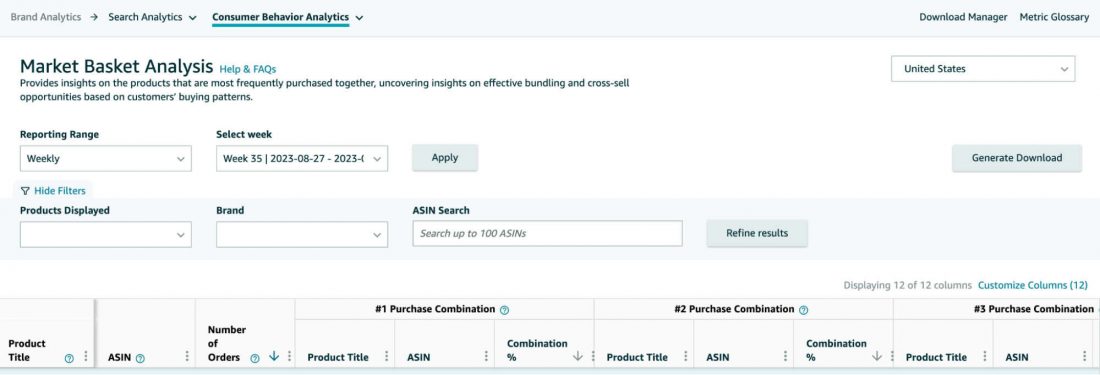
How to use it:
- Bundling: If customers consistently buy your yoga mat alongside a specific brand of resistance bands, create a bundle listing.
- Product expansion: If the most common co-purchased item is a complementary product you don't sell, that's your next product development signal.
- PPC targeting: Run Sponsored Products campaigns targeting the ASINs that appear most frequently in your basket analysis — those shoppers already buy alongside your product.
📌 Note: Basket data updates weekly and reflects actual purchase behavior, not browsing or wishlist activity. This is purchase-intent data, not browsing data — it's unusually reliable.
Best for: Product bundling strategy and identifying adjacent product opportunities.
Demographics Report
This report breaks down who your customers are — age, household income, education level, gender, and marital status — based on aggregated Amazon shopper data.
How to use it:
- Ad targeting: If your typical buyer is 25–34 with a household income of $50K–$75K, refine your Amazon DSP audience targeting to match.
- Messaging: If your core demographic skews significantly toward one age group or income bracket, your A+ Content and bullet points should speak directly to that person's use case.
- Product positioning: If your actual customer demographics differ from who you assumed would buy, revisit your pricing, imagery, and brand story.
⚠️ Warning: The Demographics report is currently only available for the US store. Furthermore, an ASIN must have 100 or more unique customers within the selected time range for the data to display. If you are selling in Europe or have a newly launched product with less than 100 orders, this dashboard will show "Not enough data available."
Best for: Refining ad targeting, sharpening brand messaging, and validating (or challenging) assumptions about your customer base.
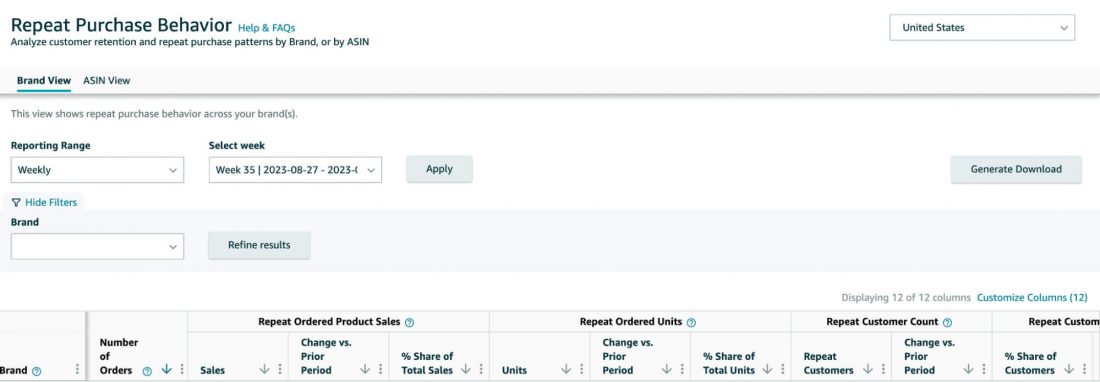
Repeat Purchase Behavior
This tracks how often customers buy from your brand multiple times — total orders, repeat purchase sales, and unique repeat customers over time.
Key metrics:
- Repeat customer count: Number of unique customers who bought from your brand more than once.
- Repeat purchase revenue: Total sales generated by repeat purchases.
- Repeat purchase rate: What percentage of your customers come back for more.
How to use it:
- Category benchmarking: A high repeat rate for consumables (coffee, supplements, pet food) is expected. A high repeat rate for a one-time purchase product (a backpack) signals strong brand satisfaction.
- Marketing ROI: If your repeat rate is low, your customer acquisition costs are higher in real terms — Every sale is a new acquisition.
- Retention triggers: For consumable products, a declining repeat rate signals a quality or pricing issue. Investigate recent reviews for clues.
Best for: Understanding customer lifetime value and identifying retention problems early.
Customer Loyalty Analytics
Customer Loyalty Analytics helps brands understand audience trends and loyalty patterns over time. Use it to identify whether your brand is building stronger customer relationships, which customer segments are becoming more valuable, and whether your retention strategy is improving.
The 4 Customer Segments:
- Top Tier: Your most valuable customers who buy frequently and spend the most.
- Promising: Customers who purchased recently and spend above average, but only occasionally.
- At Risk: Past customers who haven't purchased recently or frequently.
- Hibernating: Customers who haven't purchased in a long time.
How to use it:
- Identify which customer segments are growing or shrinking over time.
- Create retention strategies for At Risk or Hibernating customers.
- Use loyalty trends to understand whether repeat buyers are becoming more valuable.
- Pair this report with Repeat Purchase Behavior to understand both product-level repeat buying and brand-level loyalty.
Best for: Understanding customer loyalty trends, segment behavior, and whether your brand is turning one-time buyers into repeat customers.
What Does an Amazon Brand Analyst Do?
An Amazon brand analyst uses data — primarily from ABA, but also from advertising consoles, third-party tools, and internal sales reports — to drive decisions that improve a brand's Amazon marketplace performance.
Day-to-day responsibilities:
Activity | Tools Used | Frequency |
Search term optimization | ABA Search Query Performance, Search Catalog Performance | Weekly |
PPC campaign analysis | Amazon Advertising Console, ABA data cross-referenced | Daily |
Listing performance diagnostics | ABA, A+ Content Manager, review analysis | Weekly |
Competitor monitoring | ABA Top Search Terms, third-party tools | Weekly |
ABA Market Basket Analysis, keyword research tools | Monthly | |
Demographic & audience analysis | ABA Demographics Report | Monthly |
Retention & loyalty tracking | ABA Repeat Purchase Behavior | Monthly |
Executive reporting | Compiled ABA data + PPC data + sales data | Monthly/Quarterly |
At Amazon itself, a Graduate Brand Analyst acts as a strategic account manager for vendors — helping them improve business metrics, providing supply chain and catalog support, and collaborating on promotional strategies and new product selection.
For brand-side analysts (working for a company that sells on Amazon), the role is more focused: the analyst is the bridge between raw marketplace data and the business decisions that grow revenue.
How to Use Amazon Brand Analytics Data to Grow Your Business
1. Turn Search Query Data into Listing Optimization
Take your top 20 search terms by purchase volume. For each one, check:
- Is the exact term in your title or bullets? If not, add it naturally.
- Is your click share below 20%? Your main image or title needs work.
- Is your purchase share below 15%? Your product page (bullets, A+ Content, reviews, price) is losing customers.
2. Build Your Product Roadmap from Market Basket Data
Sort your Market Basket Analysis by frequency. The top 3 co-purchased products you don't sell are your highest-confidence product expansion opportunities — these are products your existing customers already buy elsewhere.
3. Align Your Ad Spend with Demographics
Run the Demographics report for your best-selling ASIN. If 65% of your buyers are women aged 35–44 with household income over $100K, your Sponsored Brands video creative, lifestyle images, and ad copy should reflect that specific person's use case — not a generic "great for everyone" message.
4. Monitor Repeat Purchase Rate as Your Quality Signal
Set a monthly alert: if repeat purchase rate drops more than 5% month-over-month for a consumable product, investigate immediately. Check recent reviews, price changes, and competitor entries. A declining repeat rate is a leading indicator of churn — catch it before it hits revenue.
Beyond ABA: How to Automate Amazon Research
Amazon Brand Analytics is powerful, but it has clear boundaries. It shows you what's happening inside Amazon's ecosystem, but it doesn't help you research what's happening outside of it.
If you're searching a way to trun repetitive browser work into constant competitive intelligence, try AllyHub — an AI copilot built for exactly this kind of work. It operates your browser directly — extracting data, analyzing patterns, and compiling structured reports — without you manually clicking through page after page.
For Amazon brand analysts and e-commerce marketers specifically, AllyHub can:
- Extract and analyze competitor reviews at scale to identify recurring complaints and product gaps that ABA's aggregate data can't surface.
- Track pricing and listing changes across competitor ASINs over time and compile them into structured comparison reports.
- Cross-reference ABA insights with external data sources — pulling together a more complete competitive picture than ABA alone provides.
- Automate repeat research workflows and save them as reusable one-click services — so your weekly competitor audit that takes three hours today takes twenty minutes next week.
The core idea: AllyHub automates the manual researching workflow, and builds it into reusable assets. It is how brands gain an intelligence advantage that compounds over time.
See how it works: Try AllyHub for free and run your first Amazon research workflow — install the Chrome extension and start immediately. No complex API setups, no code.
Frequently Asked Questions
What is Amazon Brand Analytics?
Amazon Brand Analytics is a free suite of reporting tools inside Seller Central, available exclusively to sellers enrolled in Amazon Brand Registry. It provides seven dashboards that use Amazon's own first-party data, making it more accurate than any third-party estimation tool.
What does an Amazon brand analyst do?
An Amazon brand analyst uses data from Amazon Brand Analytics, advertising consoles, and third-party tools to optimize a brand's marketplace performance. Their core work includes search term optimization, PPC campaign analysis, listing performance diagnostics, competitor monitoring, product expansion research, and executive reporting. They bridge the gap between raw data and business decisions that grow Amazon revenue.
How do I access Amazon Brand Analytics?
You generally need a professional selling account connected to a brand enrolled in Amazon Brand Registry. Brand Registry requires an active registered trademark or eligible pending trademark application, plus brand information and product or packaging proof that meets Amazon’s requirements.
Which Amazon Brand Analytics report is most important?
For many brands, Search Query Performance is the most actionable starting point because it shows search-funnel performance by query. However, the “most important” report depends on the business question: Market Basket for bundling, Repeat Purchase Behavior for retention, Demographics for audience strategy, and Search Catalog Performance for portfolio-level decisions.
Is Amazon Brand Analytics free?
Yes. ABA is completely free for sellers enrolled in Amazon Brand Registry. There is no additional cost beyond the Brand Registry enrollment process, which requires a registered trademark.
Why can't I see the Demographics report?
The Demographics report requires a minimum threshold of purchase data to populate. If you are selling in Europe or have a newly launched product with less than 100 orders, this dashboard will show "Not enough data available."
What's the difference between ABA and third-party tools like Jungle Scout or Helium 10?
ABA uses Amazon first-party aggregated data that third-party tools cannot access, so it is more authoritative for eligible brand-owned performance than third-party estimates. Third-party tools like Jungle Scout estimate market data using scraped information and algorithms.