A Twitter competitor analysis helps you see what is actually working in your niche—not just which accounts have the most followers.
Compare competitors over the same time period, analyze their reach, engagement, content mix, and top-performing posts, then turn those patterns into tests you can run on your own account.
This guide shows you how to do it in 8 steps, including a Twitter SWOT analysis for your own account, to turn competitor insights into your next content decisions.
Key Takeaways
- Compare performance, content and audience response, not just follower counts.
- Use a consistent timeframe and benchmark to separate patterns from one-off viral posts.
- Turn competitor insights into specific content tests for your own X account.
What Is a Twitter Competitor Analysis?
A Twitter competitor analysis is a structured review of X accounts in your niche, covering their performance, posting patterns, content formats, topics and audience engagement. It blends quantitative data (engagement rates, posting frequency) with qualitative analysis (tone, hook styles, narrative patterns) to reveal not just what performs well, but why.
For creators, a competitor doesn't have to sell the same product. Any account competing for the attention of your target audience can be part of your analysis.
How to Automate Twitter Competitor Analysis with AllyHub
If you want to analyze several X competitors without building the audit manually, AllyHub puts the research into a repeatable workflow.
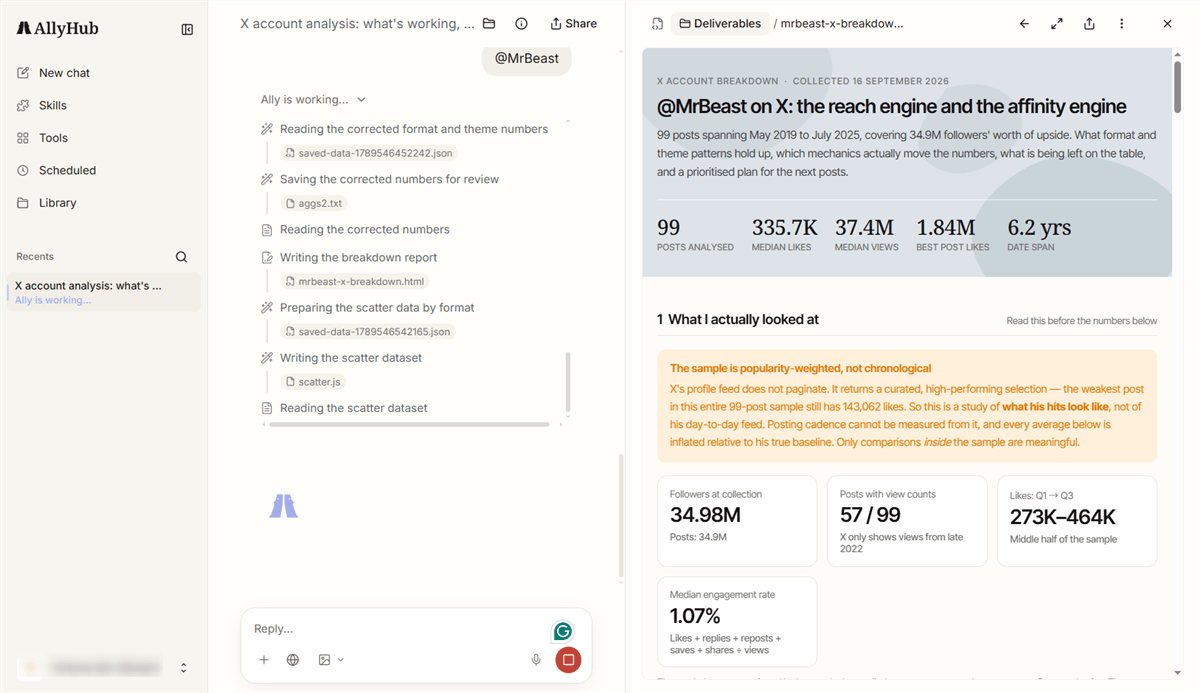
Radars — Creator Watch is the main tool for competitor analysis. Add X creators or competitor accounts to track their content performance, viral posts, positioning, and recurring success patterns. You can run scans manually or schedule them, then review the results and save individual posts for deeper analysis.
Radars — News & Trends is useful when you want to keep specific X accounts on your radar. It can track selected accounts alongside keywords and news sources, so you don't have to start competitor monitoring from scratch every time.
Then use Social to bring the comparison back to your own X account. Social connects to X, shows follower and engagement data and individual post details, and generates AI analyses covering performance, winning content patterns, content gaps, and next-topic ideas. That gives you a second side of the benchmark: what competitors are doing versus what is working on your own account.
For example, you can use Creator Watch to identify a competitor's recurring high-performing formats, check the same topic or format against your own Social data, and turn the gap into your next content test.
How to Do a Twitter Competitor Analysis [8 Steps]
Step 1: Define the Purpose and Scope
Before collecting competitor data, define what you need the analysis to answer. Competitor analysis helps you set realistic goals, evaluate your performance in market context, and find new content ideas — but only if you start with a clear question.
A simple starting point:
"I need to know ___ so I can decide ___."
For example:
- "I need to know which video formats get the most saves in my niche, so I can decide which two to test this month."
- "I need to know how often top competitors post threads, so I can decide whether to increase my own thread frequency."
Keep the scope narrow enough to act on. "Post better content" is too broad; "test two video formats this month" gives the analysis a clear purpose.
Step 2: Identify Your Competitive Set
Your competitive set should include more than accounts selling the same product. On X, creators, media accounts and other voices competing for your audience's attention can be just as useful to study.
A practical six-account set can include two or three direct competitors, two or three adjacent accounts with the same audience but different content angles, and one or two aspirational accounts worth studying for their execution.
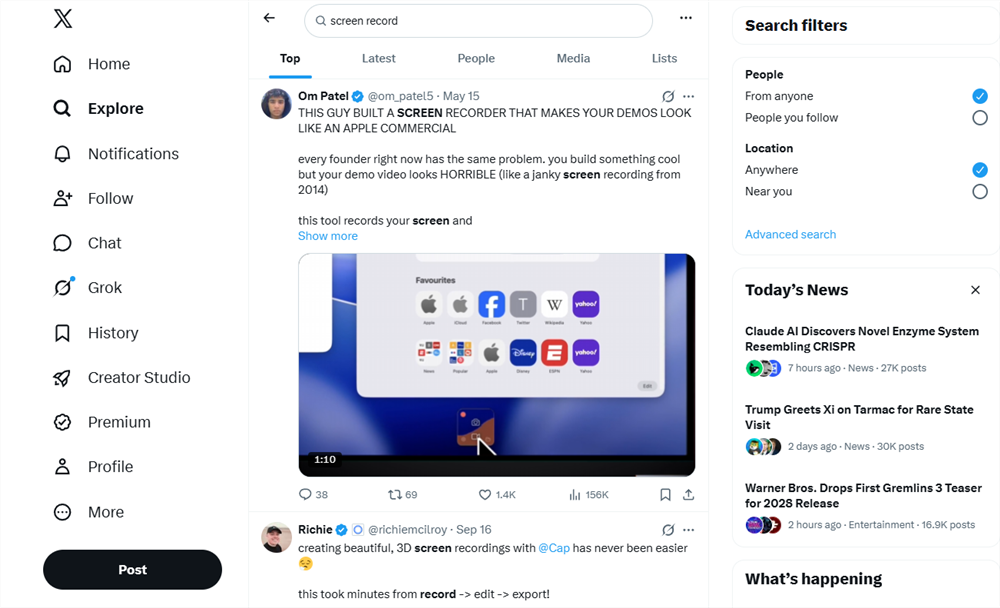
Look for accounts that repeatedly appear in conversations around your niche, not just the largest accounts by follower count. Search your audience's problems and topics, see who participates in relevant conversations, and review the accounts your audience already follows or interacts with.
Step 3: Set a Timeframe and Data Collection Window
Compare competitors over the same period. A 30-, 60- or 90-day window can work depending on how quickly your niche changes; 90 days is a useful default when you want enough posts to identify recurring patterns.
During that window, collect both performance data and examples of the content behind it. Save high-performing posts, recurring series, notable campaigns and relevant conversations so you can connect results with the tactics that produced them.
Don't rely entirely on whatever X currently ranks as “Top.” Older posts can keep appearing because of accumulated engagement, which can skew a current benchmark. A fixed date range gives your comparison a consistent frame.
Step 4: Compare Competitor Performance and Growth
Start with the numbers, but focus on the ones that matter most. Priority metrics for competitor analysis:
- Engagement rate — the fairest comparison across accounts of different sizes (engagements ÷ reach or followers)
- Engagement quality — replies and quote posts signal deeper audience connection than likes alone
- Posting volume — how often competitors publish, and whether frequency correlates with performance
- Follower growth — when publicly available, shows whether an account is gaining momentum
For your own benchmark, calculate the median rather than the average. One viral post can make an account look far more consistently successful than it actually is.
Keep in mind that public competitor analysis has limits. Private impressions, click-through rates, audience demographics, historical follower data, and revenue are generally unavailable from the outside.
Step 5: Analyze Content Themes, Hooks and Formats
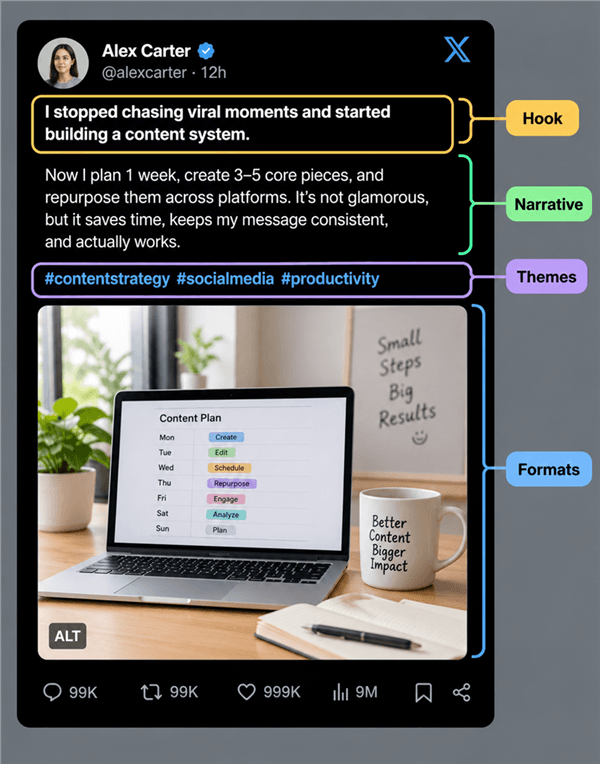
Numbers tell you which posts performed. Content analysis helps explain why. Review the strongest posts from each competitor and look for recurring themes, narratives, hooks and formats. Note whether successful posts rely on strong claims, questions, data, personal stories, demonstrations or other opening patterns.
Then compare the content mix. Are competitors relying heavily on text posts, videos, threads, images, polls or recurring series? Are certain formats noticeably underused in your niche?
The goal is to identify patterns you can test—not to copy individual posts. A recurring format or narrative is more useful than a single viral example because it gives you something you can reproduce and evaluate.
Step 6: Analyze Posting Patterns and Conversation Participation
Look at how often competitors publish, how consistently they post and whether their activity changes around launches, news or industry events. Posting patterns to track:
- Frequency — daily, multiple times per day, or weekly?
- Consistency — do they post at similar times, or is it irregular?
- Event-driven spikes — do they increase posting around product launches or industry news?
Timing can provide useful hypotheses, but don't treat a competitor's posting schedule as proof of the best time for your account. Test those windows against your own performance.
Then examine conversation participation: Do competitors regularly reply to customers or creators? Do they quote-post breaking news? Do they initiate industry conversations? Do their strongest posts attract questions, objections, detailed experiences or mostly low-effort reactions?
This shows you how competitors participate in the wider conversation, not just what they publish themselves.
Step 7: Find Gaps and Assess Your Competitive Position
Once you've compared performance, content and conversation patterns, look for areas competitors consistently overlook.
A gap might be an underused topic, format, recurring series, audience question or type of conversation. It can also be a weakness in your own content mix that becomes obvious when compared with the competitive set.
This is where a Twitter SWOT analysis and examples can help organize the findings:
What to look for | Examples | |
Strengths | What your account already performs well | Your engagement rate (3.2%) beats 4 of 6 competitors over the last 90 days |
Weaknesses | Where your performance or content mix falls behind |
Keep each quadrant evidence-based. Use a metric, date, post, or named account instead of vague statements such as “strong engagement” or “weak content.”
Step 8: Turn Insights Into a Testing Roadmap
The final step is to turn the analysis into specific experiments.
Choose a few findings to test over the next four to eight weeks. You might test a recurring format, a different hook style, a topic competitors are performing well with, an underused X feature, or a posting cadence suggested by your research.
For each test, define the hypothesis, the number of posts you will publish and the metric that determines whether you keep it.
For example:
Test | Hypothesis | Measure |
Number-led hooks | Specific numbers increase initial attention | Views and engagement rate |
Short workflow videos | Demonstrations generate more saves | Save ratio |
Don't try to copy everything a competitor does. Test the patterns that fit your audience, resources, and positioning, then use the results to update your next analysis.
Revisit the competitive set and benchmarks periodically—quarterly is a practical cadence for most accounts—because topics, formats, competitors and audience behavior on X change over time.
FAQ
How long does a Twitter competitor analysis take?
Two to three hours for a first pass over six accounts and a 90-day window, then about 30 minutes for a monthly refresh once the audit sheet exists. Collect all metrics first, then read them — mixing the two is what turns a two-hour job into a three-day one.
Can I see a competitor's impressions or audience demographics?
No. Impressions, click-through, follower growth history and demographics are account-private. What is public is post-level: views, likes, replies, reposts and bookmarks. Any tool that displays a competitor's impressions shows a modelled estimate.
Is it allowed to automate collecting competitor data from X?
Only within X's rules. Automation is expected to run through the official API with rate limits, and screen scraping, browser automation and unofficial APIs are prohibited — see X's automation development rules and X's rules and best practices. Manual collection, or platforms with properly authorised data access, is the safe route.
How often should I redo the analysis?
Deep pass quarterly, light check monthly. Formats shift faster than niches, so the monthly check only needs one answer: has a new format entered your niche's top quartile?
Can AI run the Twitter competitor analysis for me?
Partly. AI tools like AllyHub's Radars (Creator Watch) can automate the data collection and pattern identification: tracking X and TikTok creators, analyzing their performance and viral hits, and surfacing recurring success patterns on a schedule. But the strategic decisions — which patterns fit your brand, what your SWOT analysis reveals, which tests to run next — still require your judgment. That's where the leverage is.