Twitter Analytics shows how your posts perform — Impressions, engagement, profile visits, and follower growth can show which content gets attention and which posts actually move people to your profile. But the useful part is figuring out why.
Here’s how to access Twitter Analytics, read the key metrics, analyze your performance, and export a report.
Key Takeaways
- Full dashboard vs. post-level analytics: Individual post metrics are available to all users. Full account-level analytics (the dashboard view) may require a Professional or Premium account — check what's available under your current plan.
- Start with the metrics tied to your goal: Impressions show exposure; engagement rate shows how people interacted with the post; profile visits and follows show whether that attention moved people toward your account.
- The useful question is “what should I do next?” Look for posts, topics, formats, and patterns that consistently perform rather than treating a single spike as a strategy.
- Export your data if you need longer-term reporting: Native analytics can be useful for current performance, but saved exports give you a record to compare over time or share with a client or team.
What Is Twitter Analytics?
Twitter Analytics, now referred to as X Analytics, is X's built-in tool for tracking how your account and posts perform. It shows post-level metrics such as impressions and engagements, along with account-level performance over time.
The analytics dashboard is focused on your own X account. X also provides separate analytics for paid advertising campaigns, but those tools are outside the scope of this guide.
How to See Twitter Analytics (Step by Step)
Method 1: How to See Twitter Analytics on Desktop
The full account-level analytics view is easier to use on desktop. Individual posts can also show their own performance data.
Step 1. Sign in to your X account. Make sure you're using the account whose data you want to check.
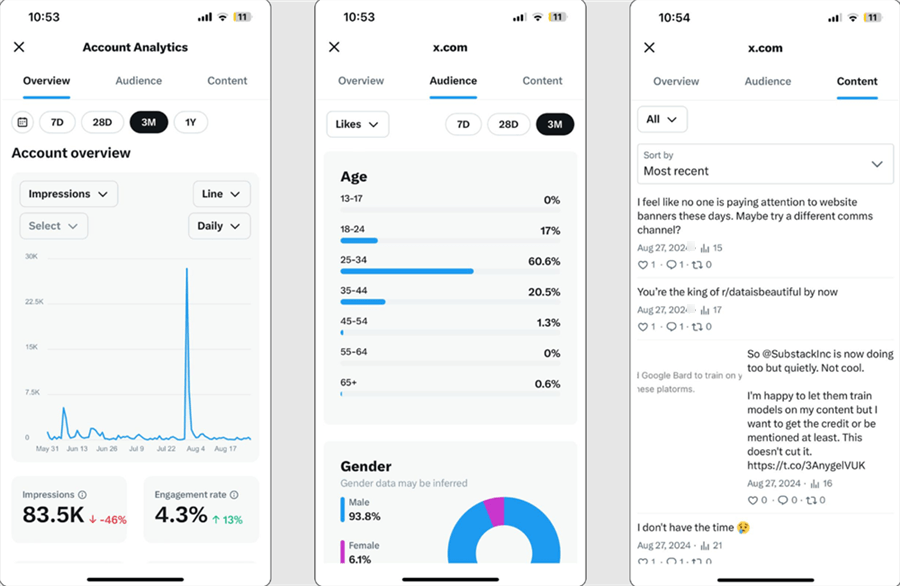
Step 2. Open X Analytics. Go to analytics.x.com and sign in if prompted. Depending on your account type, you'll land on either the full Post Activity Dashboard or a limited view — both show post-level data.
Step 3. Start with the account overview. Review recent account-level performance, then move into individual post data to see which posts generated impressions and engagement.
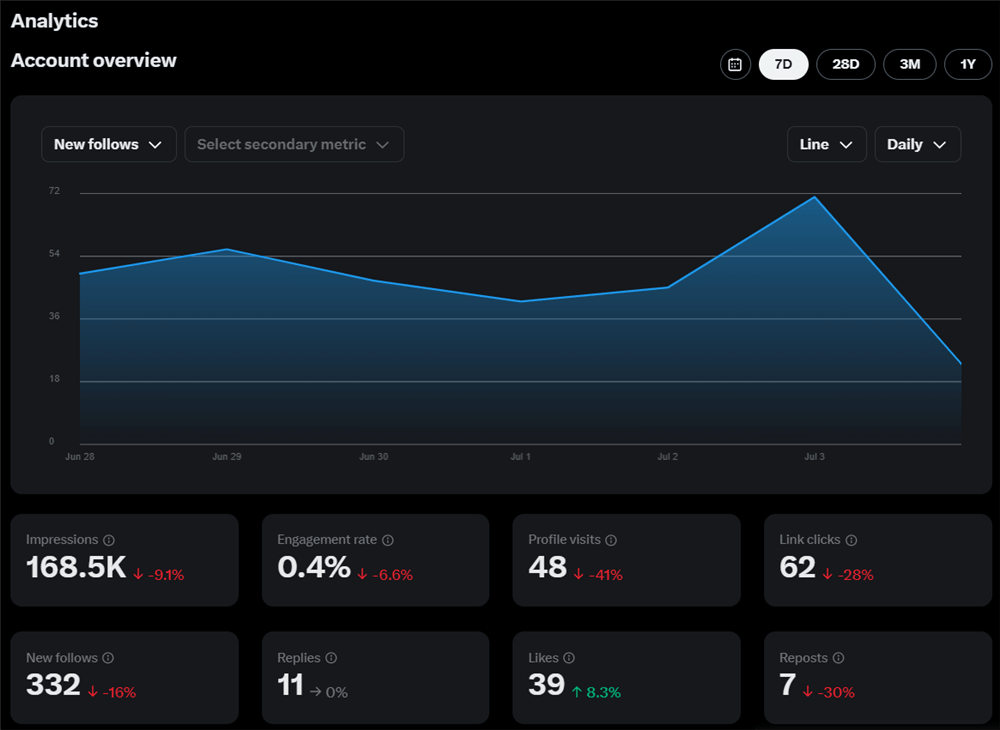
Step 4. Open a post for more detail. Post analytics can include impressions, engagements, profile visits, link clicks, and other interactions depending on the post type.
Step 5. Adjust the date range when available. X's Post Activity Dashboard uses a 28-day view by default, with options to change the reporting period.
Method 2: How to Check Twitter Analytics on Mobile
The broader account-level view is better handled on desktop, while the X mobile app is useful for checking individual posts:
Step 1. Open the X app and go to your profile.
Step 2. Open one of your posts.
Step 3. Tap the analytics icon or the option to view post analytics.
Step 4. Review the available metrics, such as impressions, engagements, profile visits, and other post-level activity.
For longer-term comparisons, account-level trends, or reporting, use the desktop analytics tools.
Method 3: Analyze Your Own X Performance with an AI Workspace
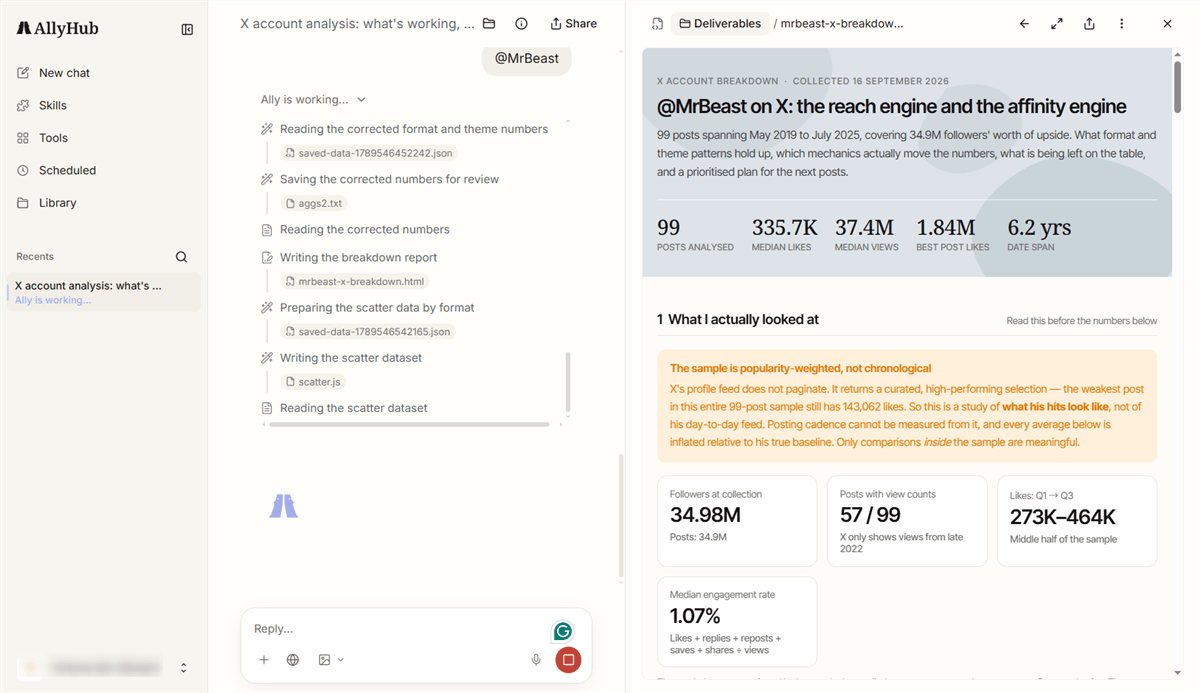
The native dashboard gives you numbers. AllyHub's Social module adds AI analysis to your own account data, so you can move from performance metrics to content decisions.
AllyHub is an AI-powered workspace for social content operations. Social connects to your TikTok and X accounts and provides account profile, follower, and engagement metrics, while syncing and refreshing your latest posts. Its built-in AI analyses include:
- Performance briefing — a plain-English summary of account performance
- Winning content patterns — identify patterns across your best-performing content
- Content gaps — find topics or formats you may be underusing
- Next topics — generate content ideas from your own performance data
- Comment audience analysis — analyze the audience engaging with individual posts and identify follow-up content opportunities
- Creator Profile builder — build a creator profile from your account data
How to get started:
- Sign up at AllyHub
- Connect your X account to the Social module. AllyHub will sync your account profile, follower metrics, and latest posts automatically.
- Review the AI analyses for your performance summary, winning content patterns, content gaps, and next-topic ideas.
- Turn those findings into your next content decisions instead of using analytics only as a post-performance report.
Social currently supports TikTok and X. AllyHub does not natively publish or schedule social posts, so Social works as the performance-analysis part of the broader Social → Profiles → Radar → Studio content workflow.
Twitter Analytics Dashboard Explained
Once you're inside, the dashboard splits into four areas, and each answers a different question.
Section | What it shows | Question it answers |
Account Home | 28-day snapshot: posts, impressions, profile visits, mentions, engagement rate | "How is the account trending overall?" |
Content / Tweets | Post-by-post performance with sortable metrics |
Account Home gives you the trend; the Content tab tells you which post drove it. If you only look at the summary, you'll know something changed but not why. Always check the Content tab before concluding.
Which Twitter Analytics Metrics Actually Matter
Not every number is worth a reaction. Here's how to read the core metrics the way a creator should.
Metric | What it measures | Why creators care |
Impressions | How many times your post was displayed | Reach and distribution — did the algorithm show it? |
Engagements | Total interactions: likes, replies, reposts, quotes, bookmarks, clicks |
Benchmarks vary by niche and account size. As a rough orientation: nano accounts (under 10K followers) typically see engagement rates in the 1–3% range; accounts under 1,000 followers can run higher. The platform-wide average is dragged down by large accounts and low-activity posts — don't use it as your baseline.
The most useful benchmark is your own account. Compare this week's engagement rate against your last 30 posts. If it beats your median, the post worked — regardless of what the platform average says.
Bonus: How to Access the Creator Dashboard on X
If you're looking for post performance and audience data, the analytics tools above cover that. The Creator Dashboard is a separate section focused on monetization — here's how to find it if you need it.
The Creator Dashboard focuses on creator monetization, including earnings and subscription-related information, rather than giving you a general view of post performance.
To access it:
- Open X and log in to your account.
- Open Monetization from the main menu. On desktop, X's current instructions place it under More → Professional Tools → Monetization.
- Open your Earnings dashboard to view available creator monetization information.
If you're looking for impressions, engagement, follower growth, or other content-performance metrics, use X's analytics tools instead. The Creator Dashboard is primarily relevant once you're working with X's monetization features.
FAQ
How do I export a Twitter Analytics report?
On desktop, open X Analytics, select your date range, and go to the Content (Tweets) tab for post-level data or Account Home for daily totals. Click Export data and choose by Tweet or by day to download a CSV you can open in Excel or Google Sheets. Because X's available analytics history is limited, export and archive your data regularly if you need monthly or longer-term reports.
Is Twitter analytics free, or do I need X Premium?
You can see basic post-level metrics directly on X, while access to some advanced features may depend on your account and subscription. X changes feature availability over time, so check the analytics options available in your own account rather than relying on older guides.
Can I see another account's Twitter analytics?
No. X's native analytics are tied to accounts you own or manage. For competitor research, you need a third-party tool that analyzes publicly available content and performance signals. AllyHub's Radar — Creator Watch tracks TikTok and X creators, analyzing their content performance, viral hits, and positioning patterns.
How often should I check my Twitter analytics?
A weekly review is enough for most creators. Look for recurring patterns in engagement, follower growth, and top-performing posts rather than reacting to every day's fluctuations. Export or record important data regularly if you want to compare performance over longer periods.