You open your analytics dashboard and see views, likes, comments, saves, watch time, followers, and more. But the numbers still don't answer the question that matters: what should you make next?
Social media analytics is useful when it changes what you publish—not when it gives you another report to read. This guide shows you which metrics to track, how to benchmark your own posts, and how to turn the patterns into your next content test.
Key Takeaways
- Start with the goal: Choose the outcome you want, then track the metric that shows whether you're getting closer.
- Compare rates, not raw counts: Likes, comments, saves, and shares mean more when you account for how many people saw the post.
- Benchmark your own content: Your last 30–90 posts are usually more useful than a generic industry benchmark.
- End every review with an action: Identify one pattern, test it in the next few posts, and see whether the result repeats.
Social Media Analytics Metrics That Matter
Social media data analytics is the process of collecting, measuring, and interpreting performance data from your social accounts to inform what you publish next. But you don't need to track every number your dashboard gives you. Start with the question you need to answer.
Question | Metrics to check |
Did the content reach enough people? | Views, reach, impressions |
Did people stay to watch? | Average watch time, retention, completion rate |
Did the content resonate? | Likes, comments, saves, shares |
For post-to-post comparisons, rates are usually more useful than raw counts. But choose the denominator deliberately: views, reach, impressions, followers, and clicks answer different questions.
Platform definitions also change. Check the current definition before comparing data across platforms or older reports. Instagram, for example, now uses Views as a core content metric, so older guides may use different terminology.
How to Use Social Media Analytics: A 6-step Workflow
This is the whole method. Run it weekly; it takes about 20 minutes once the sheet is set up.
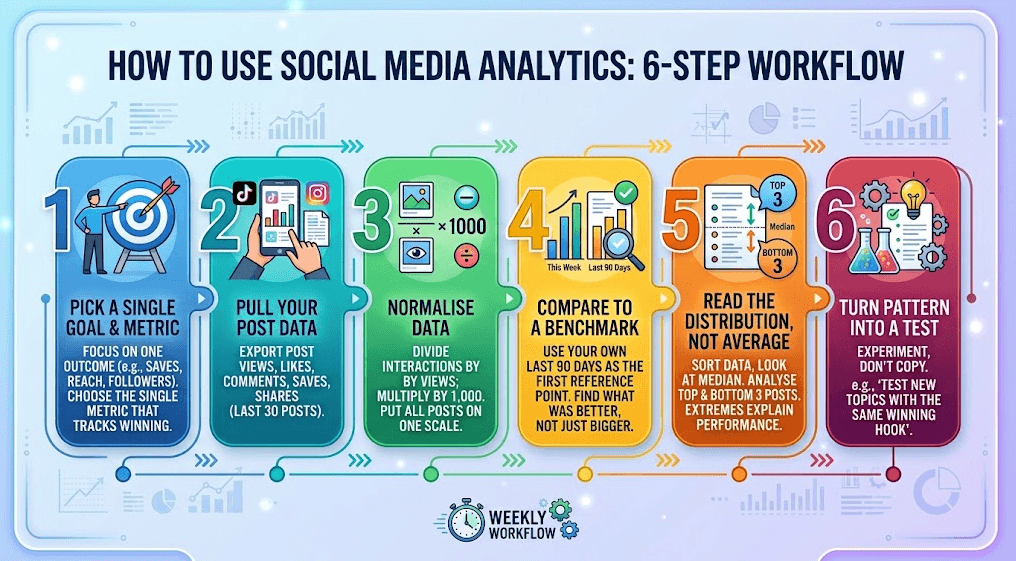
Step 1: Pick one goal and one number
Choose a single outcome for the next 30 days — grow saves, grow followers, grow reach — and pick the one metric that moves when you win. A goal with three metrics attached is not a goal; it's a mood board.
Step 2: Pull your own data first
Export or hand-copy your last 30 posts: views, likes, comments, saves, shares, and the date. Platform-native analytics is enough to start — TikTok's analytics help centre and Instagram's guide to viewing insights walk through where each metric lives.
Step 3: Normalise everything
Divide every interaction type by views and multiply by 1,000 — this is your per-1,000-view rate. Views work as the denominator here because it reflects actual exposure. If you're tracking follower growth or click-through, swap in the denominator that matches the question.
Step 4: Compare against a benchmark, not a gut feeling
"Good" only means something relative to a reference point. Use your own last 90 days as the first benchmark. Once you have a number, you can tell whether this week was actually better or just bigger.
Step 5: Read the distribution, not the average
Sort the sheet, look at the median, then look at the top three and bottom three. The average hides the shape of your performance; the extremes explain it.
Step 6: Turn the pattern into a test
Don't copy one winning post and assume you found the formula. Turn the finding into a small experiment.
For example: “Confession-style hooks produced the highest comment rate in my recent posts. I'll test two more with the same hook structure but different topics.”
The next review tells you whether the pattern repeats.
How to Analyze Social Media in One Workspace with AI Tool
Spreadsheets and native dashboards show you what happened. AllyHub takes the next step — its Social module connects your own TikTok and X accounts and turns account- and post-level data into analysis and content decisions:
- Performance briefing on your recent posts, highlighting patterns behind stronger and weaker performance.
- Winning content patterns — recurring patterns in the posts that perform best.
- Content gaps and next-topic suggestions based on your own performance data, rather than generic advice.
- Comment-level audience analysis on individual posts, surfacing recurring questions, themes, and follow-up content opportunities.
- Your own account data — plays, likes, comments, shares, and per-post content details from the TikTok and X accounts you connect.
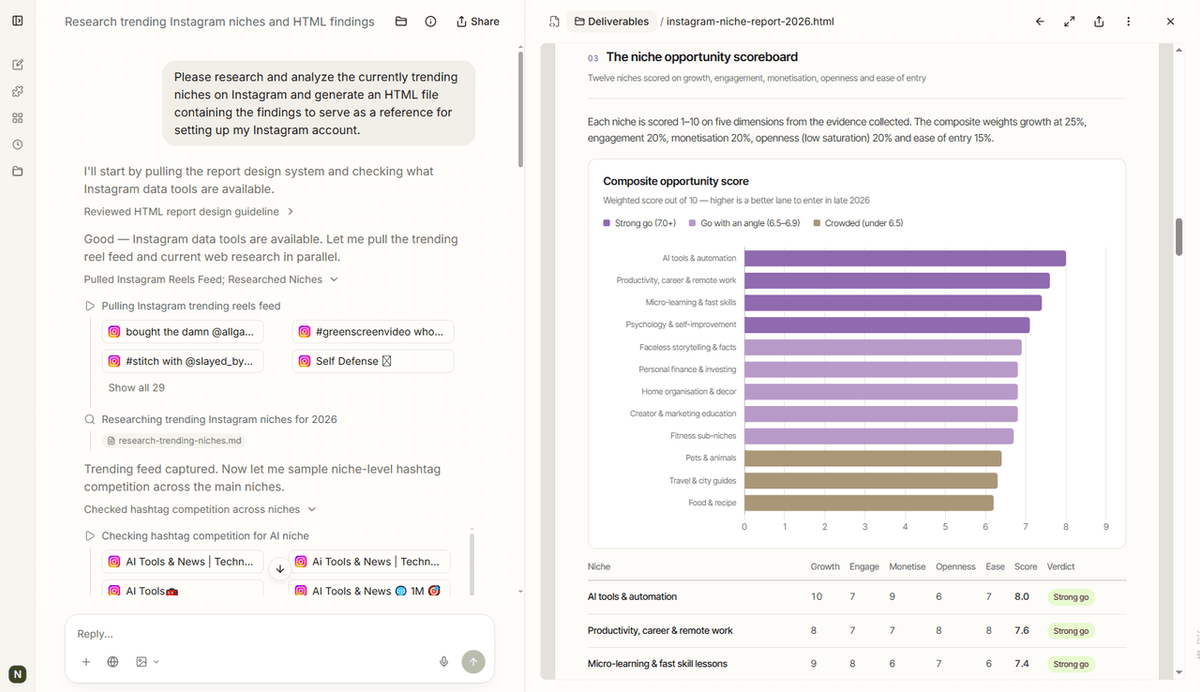
The other half of the analysis sits in Radars, which monitor news and trends, fast-growing TikTok videos, and selected creators — manually or on a schedule. AllyHub summarizes what is changing, explains why content is working, and generates content ideas. Profiles keeps your positioning, audience, and brand voice consistent, while Studio turns research and insights into long-form drafts.
Two honest boundaries: Social currently covers TikTok and X, and AllyHub is not a full social-listening suite with traditional sentiment or share-of-voice reporting. It also does not publish or schedule posts. It is the analysis-and-creation layer around the accounts and research you already use.
Pricing: free access with daily credits for a limited time; paid plans start at $15.99/month, with 20% off on annual billing.
FAQ
How often should I review social media analytics?
Weekly for tactical calls, monthly for strategy. Weekly catches format-level signals while they're still actionable; monthly is where slow shifts show up.
What is a good engagement rate?
There is no universal number — anyone quoting one across platforms is guessing. Compare against your own 90-day median first, then a like-for-like sample in your niche.
Do I need a paid tool to do social media analysis?
No. Ten minutes a week in a spreadsheet built from native analytics beats most subscriptions early on. Paid tools earn their place when you need cross-platform reporting or analysis you don't want to do by hand.
How do I analyse a competitor's content without their private metrics?
Use what is public — views, likes, comments, shares and saves, plus cadence and format — and convert to rates per 1,000 views so a large account and a small one compare fairly. Comment sections are free audience research too.
What if my views are rising but my engagement rate is falling?
That usually means distribution widened faster than the content resonated: the platform found a broader, less-interested audience.