
Browser-based collection
Collect from real websites via the browser, even when content loads dynamically or sits behind your own login.
Allyhub collects data from websites and files, cleans and structures it, then analyzes it into charts, summaries, and insights. The whole chain — scrape, clean, analyze, report — happens in one place, without code, formulas, or exporting between tools.
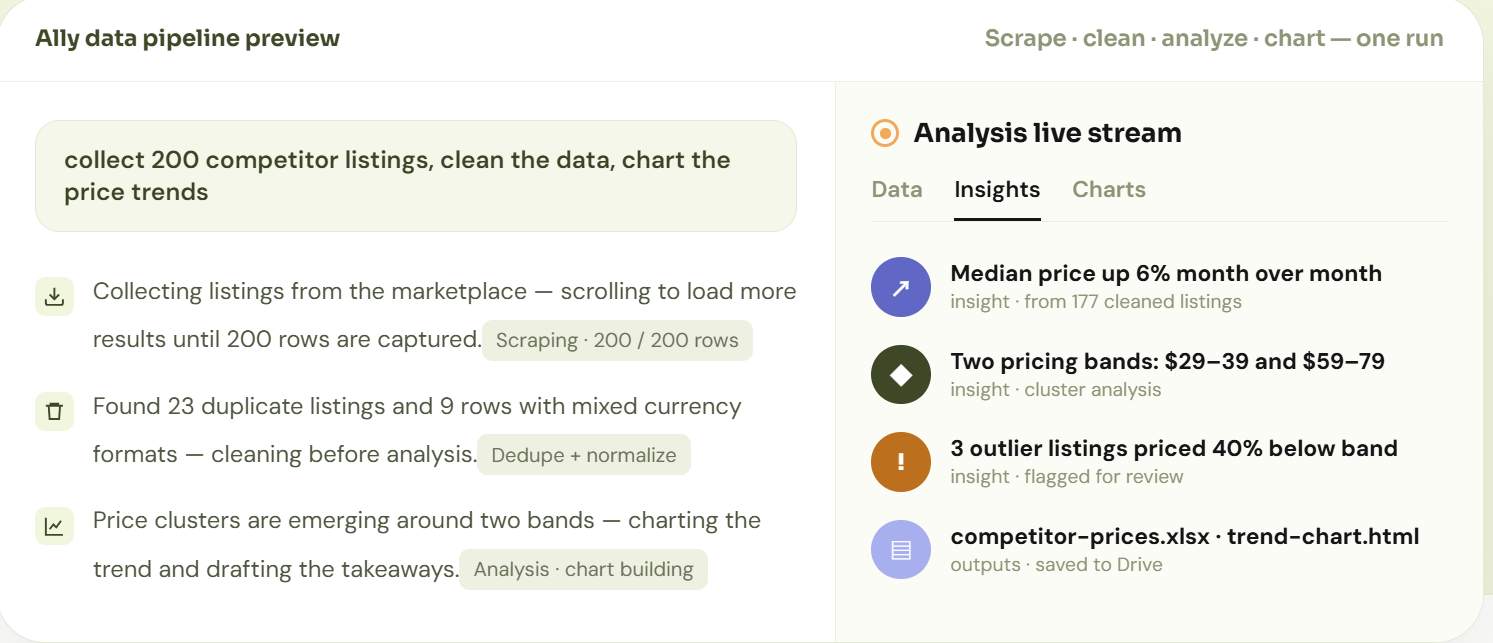
One chain, no tool-switching — Most tools do one piece: a no code web scraper collects, a spreadsheet holds, a BI tool charts. Allyhub runs the chain end to end, so raw pages become explained insights without you ferrying data between apps.
Collect from real websites via the browser, even when content loads dynamically or sits behind your own login.
Skip the manual cleanup: dedupe, formatting, and structuring are part of the run.
Get the "so what": summaries and insights alongside the tables and charts.
Data Analysis covers the pipeline that usually takes several tools: an AI web scraper for collection, cleanup for messy inputs, and analysis that explains what the numbers mean.
Pull product prices, customer reviews, listings, company profiles, and search results out of the sites that hold them.
Work with spreadsheets, CSV exports, and other raw data you already have.
Remove duplicates, fix inconsistent formats, and fill the gaps that break analysis.
Turn unstructured page content into organized rows, columns, and fields.
Surface trends, comparisons, outliers, and plain-language takeaways from the data.
Generate charts and visual summaries so patterns are visible at a glance.
Describe what you want to learn, point Allyhub at the source, and it carries the data through collection, cleanup, analysis, and reporting.
Name the websites, pages, or files that hold the data.
Allyhub scrapes the web data or reads your uploaded files.
Duplicates, formatting issues, and noise get resolved into a tidy dataset.
It runs the comparisons and finds the patterns worth knowing.
Results arrive as spreadsheets, charts, and insight summaries.
Save the pipeline as a Service and rerun it when the data updates.
Use Data Analysis when the numbers you need live on marketplaces, review sites, directories, dashboards, or in files nobody has time to clean. One dataset can become a full analysis workflow.
Watch how competitor pricing moves over time and see what review data says about products.
Collect campaign, creator, and lead data, then measure what performs.
Pull listings into structured tables and compare pricing across areas.
Organize sourcing data and spot patterns across roles and markets.
Clean collected datasets and turn them into charts and findings.
Rerun the same collection-and-analysis pipeline on every reporting cycle.
Each analysis ends in files built for the next step — sharing with a team, feeding a report, or archiving for the next comparison.
Clean, structured datasets ready for any downstream tool.
Organized tables in Excel — scraped records, cleaned data, and results.
Analysis write-ups with charts, comparisons, and key takeaways.
The full scrape-clean-analyze pipeline saved to run again on fresh data.
Point Allyhub at the pages or files that hold your data. It collects, cleans, analyzes, and reports — then keeps the pipeline ready for the next run.