Instagram Story analytics show how many people viewed your Stories, how they interacted with them, and how they moved through your Story sequence.
You can check these stats and your Story viewer list directly in Instagram. This guide explains how to find them, what each metric means, and which numbers to use when deciding what to post next.
Key Takeaways
- Views, viewers, and reach answer different questions. Views show viewing activity, while reach measures the unique accounts reached.
- Navigation metrics reveal drop-offs. Forward taps, back taps, and exits show how viewers move through your Stories.
- Use your own baseline. Compare Story performance with your recent four-week average, not generic benchmarks.
How to See Instagram Story Viewers
If you want to see who viewed your Story, start by opening the Story you posted:
Step 1. Open your own story. Tap your profile photo at the top of your feed or profile, so your story starts playing.
Step 2. Swipe up on the screen. The viewer list opens at the bottom, with the total count at the top. (On some versions, it's a small viewers icon in the corner.)
Step 3. Scroll to load everyone. Instagram loads viewers as you scroll, so keep going if the list looks short.
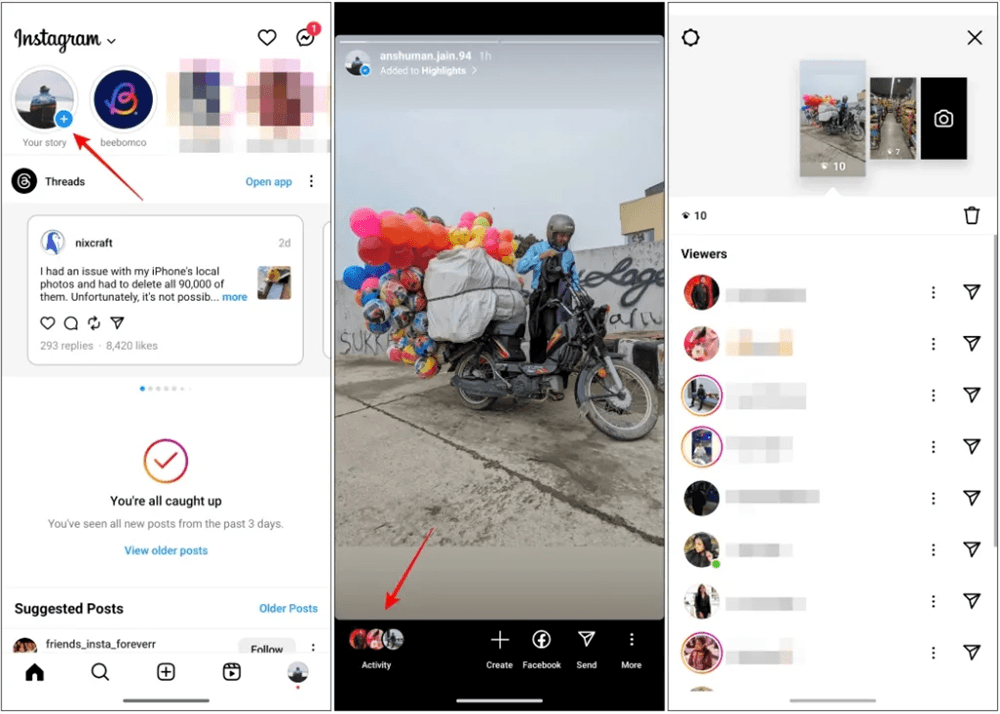
For expired stories, open your profile menu → Archive → tap the story → viewer info to see who's seen your story. Availability can vary by account type, so treat the live view as the reliable one.
Instagram Story metrics explained
Don't judge a Story by views alone. Each Instagram Story metric answers a different question. Here are the metrics and how you can read them:
Metric | What it tells you | How to read it |
Views | Total times the Story was viewed | Shows overall viewing activity; compare with unique accounts rather than using it alone |
Viewers / Reach | Estimated number of unique accounts that saw the Story |
Note: Instagram's available metrics and labels can vary by account type, Story format, and app version. Use the metrics actually shown in your Insights rather than trying to force every Story into the same report.
Discovery, interaction, and navigation
The metrics become easier to use when you group them by the question they answer:
- Discovery: Views and unique viewers/reach show how widely the Story was seen.
- Interaction: Replies, shares, link clicks, and sticker taps show what viewers chose to do.
- Navigation: Taps forward, taps back, Next story, and exits show how viewers moved through or away from the Story.
You can focus on the metrics that match the job of the frame, rather than every number for every Story. A link Story should be judged partly by clicks; a question Story by replies; a multi-frame tutorial by navigation and completion.
Views vs. viewers vs. reach
These numbers are easy to confuse because they describe different things.
If a Story has 4,000 views and 2,900 unique viewers, the Story generated more viewing activity than it reached unique accounts. The difference can come from people viewing more than once or from how Instagram counts views for that format.
The useful distinction is:
- Views: How much viewing activity did the Story generate?
- Viewers / Reach: How many unique accounts did it reach?
- Interactions: What did those accounts do?
A higher view count is not automatically better. Compare these numbers with your own previous Stories and with the action you wanted viewers to take.
How to Read Your Instagram Story Stats
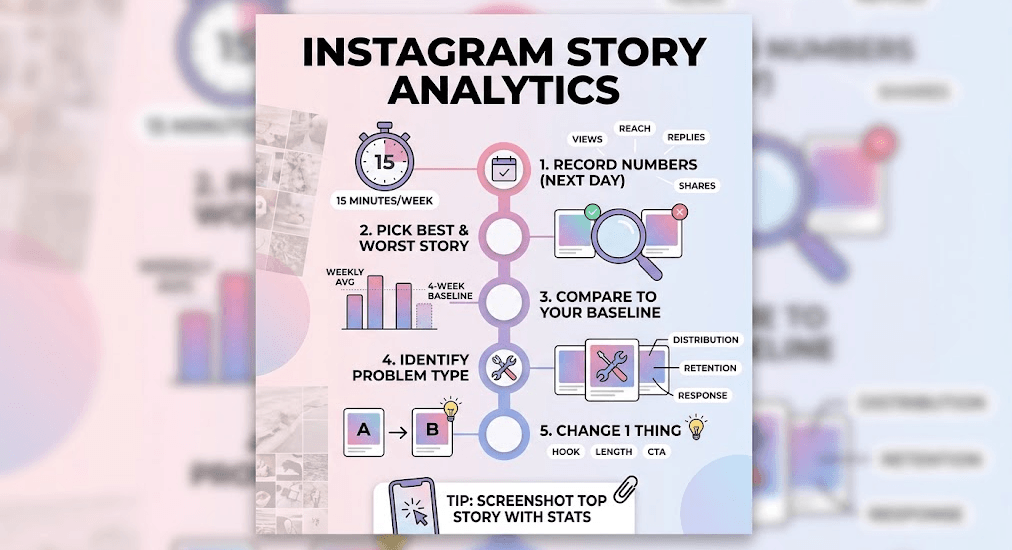
Start with the Stories that clearly over- or underperformed. Compare them with your recent baseline, then look at the frame where viewer behavior changed. Pick one variable to test in the next sequence.
- Record the numbers. The day after posting, log the key metrics for each Story: views, viewers/reach, replies, shares, relevant clicks or sticker taps, and navigation metrics.
- Pick one strong and one weak Story. Look for clear outliers rather than trying to analyze everything.
- Compare with your four-week baseline. Your own recent performance gives you a more useful reference point than a generic industry benchmark.
- Identify the problem type. Is the issue distribution, retention, or response?
- Change one thing next week. Test a different opening, shorter sequence, clearer payoff, or stronger interaction prompt rather than changing everything at once.
Quick habit: Save a screenshot of your strongest Story alongside your weekly numbers. After a few weeks, you can compare the actual creative with the performance instead of relying on memory.
Why your Instagram Story views drop
A drop in views doesn't automatically mean your content has become worse. First, check whether the change is isolated to one Story or part of a longer trend.
Common factors include:
- Posting changes. A different cadence or posting time can change who sees a Story.
- Audience settings. Privacy, Story visibility, and audience controls can affect reach.
- Seasonality. Holidays, weekends, major events, and changes in audience behavior can move viewing patterns.
- Content format. A format that previously performed well may stop attracting the same level of attention.
- A weak first frame. If viewers move forward or exit early, the opening may not give them a reason to continue.
Look at several metrics together. If views fall but unique reach remains relatively stable, the issue is different from a Story that loses both reach and retention.
How to Turn Instagram Analytics Into Better Content
Instagram Insights tells you how your Stories performed. AllyHub can help with the work that comes after the analysis.
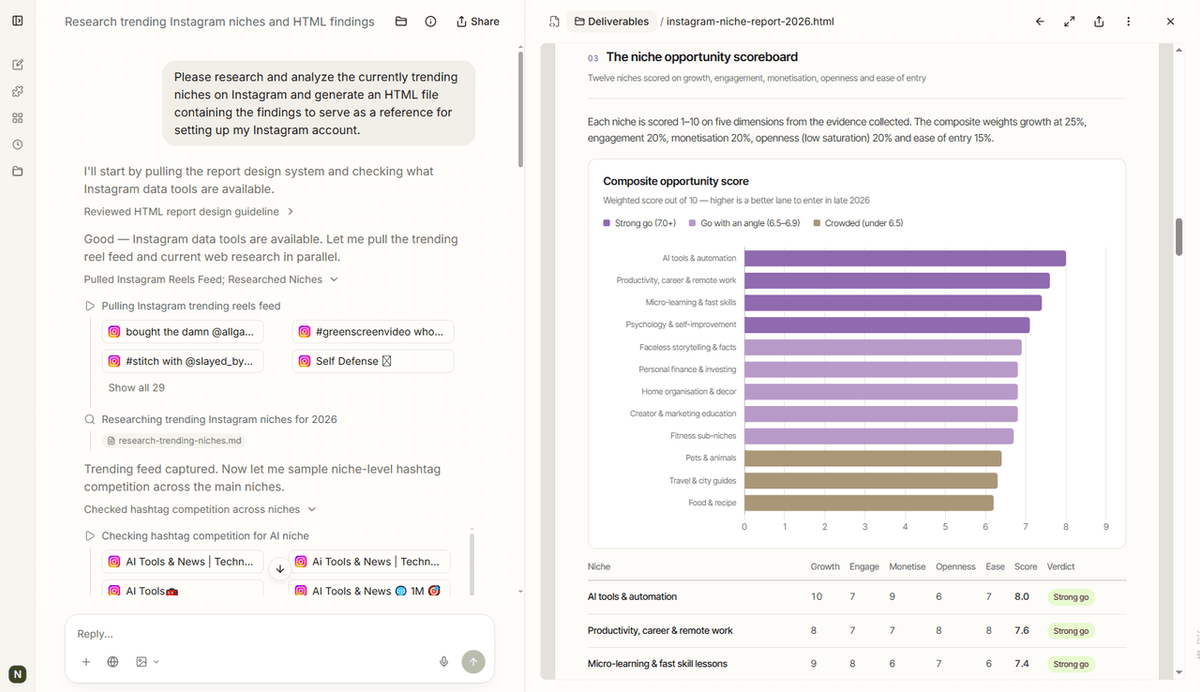
Use Profiles to keep your brand and audience context consistent, then use Studio to develop the next long-form content from the patterns you've identified. If you want to research topics or creators beyond your own Instagram data, Radars can help you track selected trends and content patterns.
The roles are different: Instagram provides the performance data; AllyHub helps you turn those findings into a repeatable content workflow.
Try AllyHub for free to build your next piece of content from what you've learned.
FAQ
How long does Instagram keep Story analytics?
Stories disappear from your profile after 24 hours, but the analytics don't vanish with them — Instagram's help center notes you can still access insights for a story after it expires, which is why the Archive path works. Treat that as a grace period rather than a permanent archive: if a number matters, log it the day after.
Can you view Instagram Story analytics on a computer?
Yes. Meta Business Suite shows Story data on desktop with a longer history than the in-app view, so operators and MCNs who plan in batches usually work there instead of on a phone.
Why did Instagram replace impressions with views?
Instagram replaced Impressions with Views as the primary metric across posts, Stories, and Reels, unifying how it measures content exposure across surfaces. Impressions may still appear in some ad reporting contexts. Any older guide comparing "story impressions" with "story views" is comparing the same thing under two names.
Can you see someone else's Instagram Story analytics?
Not directly. Story insights are private to the account owner. Third-party tools estimate a competitor's story performance from public signals — treat those numbers as directional, not exact.
What's a good view rate for Instagram stories?
There's no universal number, and any guide handing you a fixed percentage is guessing. Your own four-week average is the benchmark. For a simple reach-rate comparison, use accounts reached ÷ followers. If you also track views, compare views separately rather than treating them as the same metric.